Download
1 / 43
430 likes | 572 Vues
Monte Carlo methods. Computing Across the Sciences. “Randomness” and Distributions.

E N D
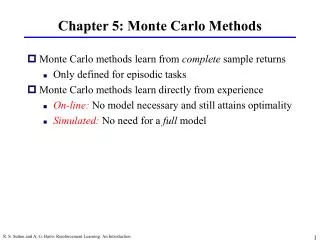
Monte Carlo methods Computing Across the Sciences
“Randomness” and Distributions In the non-science world, the word "random" often means "without pattern". However, in science, the word "random" rarely means that. Rather, a "random number" is a number chosen from some distribution of numbers. The "random number" does not take just one value, but rather any value from the distribution; the distribution is the "pattern" of the random number. What, precisely, is a distribution of real numbers? Let's consider two types of distributions, each with many applications in science: discrete and continuous. Computers never generate truly "random" numbers, but many programs have built-in "pseudo-random" numbers that are sufficient for most purposes.
Discrete Distributions • In a (finite) discrete distribution, there is a list of real numbers that can be achieved by the "random" number; let's call these numbers x1,x2, ..., xn. For each number xi, there is a probability pi between 0 and 1 that is the chance that the random number equals xi. Since the random number must equal one of the xi, the total of the probabilities must be 1: (We could also have an infinite discrete distribution, where there is an infinite list of real numbers that can be achieved by the "random" number: x1, x2, ..., and a probability pi for each one, and then it would be the infinite sum of the probabilities that would equal 1. We will not deal with this case here).
Discrete Distributions As an example, consider tossing a coin, where "heads" is associated with the number 1 and "tails" associated with the number 0, and each case happens half of the time on average. Thus, our distribution has x1= 0, x2= 1, p1= 1/2, p2= 1/2. How can we reproduce such a distribution on the computer? Technically, we can not. No computer can ever generate a truly random distribution. However, there are many algorithms for generating "pseudo-random" numbers according to some distribution. These "pseudo-random" distributions are sufficient for most purposes (though you should always keep in mind that they are not truly "random").
Discrete Distributions For example, in Mathematica, Random[Integer] generates 0 half of the time and 1 the other half of the time (like tossing a coin).
Discrete Distributions If you want more control, you can specify the range of random integers. For example, here is how to get a list of 10 random integers between 3 and 9.
Discrete Distributions With some creativity, you can generate random numbers that are more likely to take on one value than another. For example, consider a loaded die, that comes up "1" one time out of 10, "2" once out of 10, "3" once out of 10, "4" once out of 10, "5" once out of 10, and "6" 5 times out of 10. We can simulate that by generating a random integer from 1 to 10, and if the integer is greater than 6, then set it to 6:
Discrete Histograms A nice way to visualize a discrete distribution is with a histogram. To make a histogram, we sort a list of random numbers into "bins" (for example, 0.5--1.5, 1.5--2.5, 2.5--3.5, etc). Then we make a bar chart in which the height of each bar represents the number of "random numbers" in that bin.
Discrete Histograms Here's how we do this in Mathematica. First we load in the Graphics`Graphics` package, which contains the Histogram command, and then we call the Histogram command, including, if we want, a specified list of cutoffs. Let's do this for 1000 rolls of our loaded die: Notice that we get approximately 50% in the 6 bar, and 10% in each other bar, as expected.
Discrete Histograms By adding the flag HistogramScale->1, we can create a slightly different sort of histogram, one where the area of each bar (not the height) is what is important, and this area represents not the number of random numbers in that bin, but rather the proportion of random numbers in that bin. This type of histogram can let us see the underlying probabilities more clearly, and will be useful as a transition to continuous distributions in the next section
Continuous Distributions In a continuous distribution, the random numbers are spread continuously over some range. In such a distribution, it doesn't make sense to talk about the probability of getting any single number---after all, is there any chance that you are exactly 6 feet tall, not 5.92, not 5.99935, not 6.000000000001? Instead, we describe the distribution by a densityfunction f(x), with the probability that the random number is between a and b being equal to the integral of f from a to b: Since the random number must be somewhere, the integral of f over all the possible random numbers must be equal to 1.
Continuous Distributions Think of the density function as just a smoothed-out histogram (with the HistogramScale->1 scaling rule, as described above). In the discrete case, it was the area of a group of bars that gave the probability of landing in those regions; now it is the area under the curve that gives you this probability.
Continuous Distributions For example, consider the "uniform" distribution of real numbers on [0,1], in which all regions in [0,1] are equally likely. The density function for this distribution is just f(x) = 1, for 0 < x < 1. This uniform distribution can be generated in Mathematica using Random[ ]:
Continuous Distributions Let's verify this by generating 5000 numbers using Random[ ] and making a histogram with 10 equal-sized bars from 0 to 1 to see that each bar is equally likely: Sure enough, this histogram is quite close to the density function f(x)=1.
Continuous Distributions We can also spread numbers nonuniformly, as in the discrete case with the loaded die. A famous nonuniform distribution is the normal distribution, or "bell curve". The density for a normal distribution has the following shape: A normal distribution is centered at some average value m (I chose m=4) and has a width determined by a parameter called the standard deviation s (I chose s=2.5)
Continuous Distributions Here we make Mathematica generate 5000 random numbers with a normal distribution with mean 68 and standard deviation 6 (Note that we first load the package Statistics`ContinuousDistributions`). We plot a histogram with 20 bars (letting the computer decide which 20 bars to choose) to verify that it simulates a normal distribution
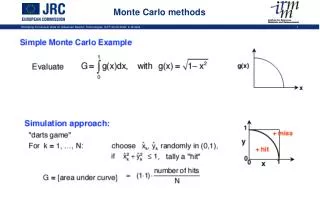
“Monte Carlo” Simulations Simulations involving random numbers sometimes go by the name "Monte Carlo", inspired by the casino city in Monaco where randomness plays a large role. We can classify a Monte Carlo simulation according to whether the underlying distribution of random numbers is discrete or continuous:
Discrete Monte Carlo Simulations Discrete random numbers are used in many scientific applications. One simple application is a random walk. A random walk is a simple model for diffusion (e.g., to describe the motion of a particle on a microscope slide as it is kicked by thermal motions of the solvent) In the simplest random walk, the particle starts at the origin, and then each second flips a coin and moves left if it is heads and right if it is tails. The example below simulates 100 steps of the process. (See Mathematica demo)
Continuous Monte Carlo Simulations Continuous random numbers also have many applications in science. For example, if we want to do a molecular dynamics simulation at some temperature T, we typically give the particles initial velocities according to the Boltzmann distribution: the velocity in each spatial direction is normally distributed, with mean 0 and standard deviation sqrt(kT/m). Below is an example of 30 particles in a box, all with mass 1, and with kT = 1. Note that particle-particle collisions are for now ignored, but you will see elsewhere in CAtS how to include them. (See Mathematica demo)
Continuous Monte Carlo Simulations Continuous Monte Carlo simulations are also used in simulating the behavior of polymers in solution. Stiff polymers, such as DNA, are sometimes modeled as “Gaussian chains”. We will treat the 2-dimensional case here, and you will have the option of exploring the real 3-dimensional problem in lab.
Continuous Monte Carlo Simulations The polymer is described by a sequence of rigid segments, attached end-to-end in the 2D plane. Let qj be the angle that the jth segment bends with respect to the previous segment. Since the polymer is stiff, the qj should be close to 0 but have some variability. One model for this effect is to give each qj a normal distribution with mean 0 and standard deviation s. Here is a program called “GaussianChain” that generates a random polymer (with 20 segments of length 1, with s=1).
Continuous Monte Carlo Simulations Often one wants to use such a simulation to determine the distribution of some quantity such as the polymer’s end-to-end distance. The program “GaussianChainEndtoEnd” below generates a random polymer and computes its end-to-end distance. To the right, we call GaussianChainEndtoEnd 2000 times and make a histogram of the results, and then compute the average of the end-to-end distance.
Metropolis Monte Carlo There is another approach to simulating a distribution, developed by Metropolis et al (1953). This algorithm works equally well for the continuous case (where we have a density function f(x)) and the discrete case (where we have a list of probabilities P(x) for each discrete x). In each simulation above, we relied on a Mathematica pseudo-random number generator tailored to our distribution. However, for many distributions, such a generator may not exist in Mathematica or other standard packages. Instead, imagine we control a little "walker" named Monty wandering in the space of numbers. Everywhere Monty steps, we record its position in some list of numbers. How can we ensure that this list has the distribution we are trying to simulate? That's what Metropolis figured out:
Metropolis Monte Carlo First we design some random way for Monty to "move". These moves need not be tied in any way to the distribution; all that matters is that Monty can potentially reach every possible number in our distribution by some combination of moves. Then, we following the following algorithm (if you have a discrete distribution, replace each f by P): 1. Let x be Monty’s current position, just recorded on the list. 2. Make a random move to a new position, x*. This is not (yet) recorded on the list. 3. (a) If f(x*) ³ f(x), then accept the move (Monty stays at x*). (b) If f(x*) < f(x), then generate a random number uniformly on [0,1]. If that number is less than f(x*)/f(x), then accept the move (Monty stays at x*). Otherwise, reject the move (Monty moves back to x). 4. Record Monty's position in the list and go back to step 1.
Metropolis Monte Carlo It has been proven that if you follow this algorithm long enough, the list will have the desired distribution. In plain language, we always accept moves to higher-probability locations, and we sometimes accept moves to lower-probability locations, but the lower-probability the location, the less likely we are to accept it. It's a simple algorithm to implement. Plus, it works equally well if instead of x being just a number, x is a vector of n numbers, or any object, really.
Metropolis Monte Carlo Let's try this on a simple example (easy enough that we could do a direct simulation if we wanted to). Let Monty roam over the (x,y) plane. Let the density function be f(x,y) = 1 for 0 £ x £ 1 and 0 £ y £ 1, and f(x,y)=0 elsewhere, i.e. a uniform distribution on the square with corners at (0,0), (1,0), (0,1) and (1,1). What about Monty's moves? We could choose a random angle uniformly from 0 to 2p, and then walk a random distance between 0 and 0.4 in that direction. Certainly Monty can in theory reach every point on the plane by those moves.
Metropolis Monte Carlo Now we run the algorithm. Note that for this f, the accept/reject rules are particularly simple. If x* is inside the square, then f(x*)=1, so we always accept the move, while if x* is outside the square, then f(x*)= 0, so we always reject the move. We run 10000 steps of this algorithm and print out Monty’s locations: they should look pretty uniform in the square.
Metropolis Monte Carlo If that “visual proof” doesn't convince you, we could try the following: compute the proportion of points inside the circle with center 1/2 and radius 1/2. That proportion should be p/4 (the ratio of the circle area to the square area) if the distribution is generated correctly:
Optimization by Metropolis Monte Carlo Here's a clever use of Metropolis Monte Carlo simulations to minimize some function E(x). Recall that with Metropolis Monte Carlo, x could be a number, or a vector of numbers, or really practically any object. First, build a density (or list of probabilities if x is discrete) based on E: Here, Z is just a normalization factor that you compute so that the integral of f over all space (or the sum of all probabilities) is 1. The parameter T is called “temperature”, for reasons that will become clear. The key is that the smaller T is, the more sharply peaked the density is around the minimum value of E (Can you see why that is true?).
Optimization by Metropolis Monte Carlo Now run Metropolis Monte Carlo on this f. Monty will tend to spend the most time in regions where f is highest (that's the whole point of Metropolis Monte Carlo), and these are the points where E is lowest (can you see why that is true?). Here's the Metropolis algorithm copied from above, but rewritten in terms of E rather than f (note 2 inequality flips): 1. Let x be Monty's current position, just recorded on the list. 2. Make a random move to a new position, x*. This is not (yet) recorded on the list. 3. (a) If E(x*) £ E(x), accept the move (Monty stays at x*).. (b) If E(x*) > E(x), then generate a random number uniformly on [0,1]. If that number is less than x*, accept the move (Monty stays at x*). Otherwise, reject the move (Monty moves back to x). 4. Record Monty's position in the list and go back to step 1.
Optimization by Metropolis Monte Carlo Now the “coup de grace”, called simulated annealing. While you are running Metropolis, gradually lower the temperature T, in the hopes of guiding Monty to the global minimum of E. This is a bit of an art: if we lower T too quickly, Monty can get stuck in a local minimum of E, but if we go slowly enough, then the Metropolis algorithm will allow Monty to climb out of the local min, head toward the global min, and then get frozen there as T goes to zero. To be sure, we should run the algorithm several times, and see if we get the same results.
Optimization by Metropolis Monte Carlo Let's try this on a simple test case, a double-well energy function of one variable: As "moves", we can have Monty shift position by a random number uniformly distributed from -1 to 1.
Optimization by Metropolis Monte Carlo Here are the results of running Metropolis Monte Carlo without simulated annealing, with T=1 fixed. We plot both the time series of the walker's positions and the overall histogram of these positions. Note that there is a peak in the histogram is near the global min around -0.7, but there is also a peak near the local min around 0.7.
Optimization by Metropolis Monte Carlo Now we lower the temperature to T = 0.4 and rerun the simulation. Note that the peak in the histogram near the global min at -0.7 is now dominant.
Optimization by Metropolis Monte Carlo This trend is further reinforced if we lower T to 0.1. Now we can even see the dominance of the global min at -0.7 in the time series.
Optimization by Metropolis Monte Carlo Finally, we do simulated annealing, with T gradually decreased from 1 to 0.01 in 1000 steps. Note that the time series eventually settles down to the neighborhood of the global min at -0.7.
Optimization by Metropolis Monte Carlo Finally, let's try this technique on a discrete minimization problem. Consider the traveling salesperson problem we saw before: a salesperson lives in city #0, must visit cities #1, 2, ..., 10 in any order, and then return home to city #0. In what order should the cities be chosen to minimize the total distance? First let's generate some random cities in the square 0 £ x,y, £ 1 (home is in red).
Optimization by Metropolis Monte Carlo This is a minimization problem, right? First we have to understand the function we are minimizing. What is the output of this function? (next slide for answer)
Optimization by Metropolis Monte Carlo The output of the function is the total distance traveled. What is the domain of this function (what kind of objects do we input)? (next slide for answer)
Optimization by Metropolis Monte Carlo The input of the function is an ordering of the numbers from 1 to 10. What are our set of moves? Remember, these have to be moves in the domain of our function. (next slide for answer)
Optimization by Metropolis Monte Carlo Our moves must act on the space of “orderings of the integers from 1 to 10”. What kind of moves are possible in this space? Well, we could choose two cities at random and swap them in the ordering. We could certainly reach any ordering in that way. (Other variants of this idea are possible)
Optimization by Metropolis Monte Carlo Here are the results of running a Metropolis simulated annealing code implementing this idea. We plot the time series of the function, and also the optimal path and minimal distance. I don’t know for sure that this is the shortest path, but I ran the code 10 times, and it found this path 5 times (and the other times it found paths of lengths 0.939, 0.939, 1.003, 1.036, and 1.127)
References [1] For further discussion of random numbers and simulation, see W. Cheney and D. Kincaid, Numerical mathematics and computing, 4th edition, Brooks/Cole Publishing Company (1999). [2] For a nice introduction to Metropolis Monte Carlo, see the beginning of the document at http://www.lpthe.jussieu.fr/DEA/krauth.html