Download
1 / 20
200 likes | 205 Vues
Characterization of Region Data. Haimonti Dutta Department of Computer Science , Temple University. Thanks to : Dr Vasilis Megaloikonomou, Dr Marc Sobel, Despina Kontos. Introduction. Content Based Image Retrieval (CBIR) Aims of an user in CBIR.

E N D
Characterization of Region Data Haimonti Dutta Department of Computer Science , Temple University Thanks to : Dr Vasilis Megaloikonomou, Dr Marc Sobel, Despina Kontos.
Introduction • Content Based Image Retrieval (CBIR) • Aims of an user in CBIR • browsing through a large set of images from unspecified sources(search by association) • category search – retrieve arbitrary image representative of some class • target search - search for a precise copy of an image Ref : Arnold W. M. Smeulders,Marcel Worring,Simone Santini,Amarnath Gupta, Ramesh Jain, “ Content Based Image Retrieval at the end of the early years”
Examples is Medical Applications : MRI Image of the brain with the visual cortex activated Regions of Interest(ROI) ROI’s can be tumors, lesions, activations in the brain etc
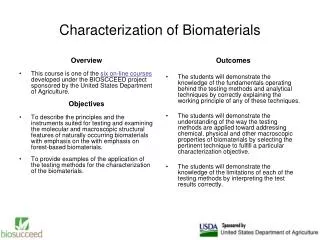
Data Preprocessing • Segmentation of ROI • Image Registration – to make image data comparable across subjects without morphological and acquisition variability. • In all our experiments we assume that these pre-processing steps have already been taken care of. (a) The original MR image (b) The Talairach atlas (c) atlas overlaid brain image Pictures from : http://www.cs.wright.edu/people/faculty/agoshtas/lijun_thesis.html
Shape Representation – the problem and its significance • 2 closely related problems : • how to describe a shape compactly • how to measure the difference of two shapes
Related work • There are many methods of representation and some of the most popular methods are as follows : • representation through ‘landmarks’ • representation through polygonisation • some coefficients of 2D DFT • Discrete Wavelet Transform • The first few moments of inertia • Numerical vectors • Fractals • Mathematical Morphology • Ref : Flip Korn, Christos Faloustos,Nikolaos Sidiropoulas,Eliot Siegel,Zenon Protopapas,”Fast and Effective Similarity Searching in Medical Tumor Databases Using Morphology”
An insight into Mathematical Morphology • The ‘pattern spectrum’ of a shape is used to map the shape to a point in k-dimensional space • Pattern spectrum of a compact binary image X relative to a convex binary pattern B is defined as differential size distribution function : • PSx(r,B) = - dA(X ° rB) / dr • PS x(- r,B) = - dA(X • rB) / dr • Some fundamental operations in mathematical morphology are • Erosion • Dilation • Opening • Closing
Fundamental Morphological Operations Erosion – shrinking the image by use of structural element Dilation – expanding an image by use of structuring element Closing – Dilation followed by an erosion Opening – erosion followed by dilation
The Morphological Distance Steps Involved : 1.Compute d*();This means take two shapes X1 and X2.Align them optimally, and compute the areas of the disjoint parts 2. Take their closings using a disk or radius 1,2 …M in each case, compute the d*() of the resulting shapes. 3.Do the same for openings with a disk or radius 1,2,…M 4.Compute the norm(L1,L2…) on the vector of disjoint areas and report that as the distance between the two shapes The morphological distance between two objects x1 and x2 is thus defined as : dEmorph(x1,x2) = (Mm=-M|d*(fmE(x1),fEm(x2))|p)1/p With f mE = x ° mE , 1 <= m < M x , m = 0 x • mE , -M <= m <= -1
Weaknesses of Mathematical Morphology • Algorithms used for implementation are complex and extremely time-consuming especially in 3D implementations • Unsuitable for many imaging problems e.g correction of a blurred image
A Novel Method of Characterization Sholl’s Analysis and the basic idea Diagram of a stellate cell showing a series of circles with increasing radii centered in its perikaryon. Picture taken from : D.A.Sholl ,”Dendritic Organisation in the neurons of the visual and motor cortices of the cat”
Region Data 3D objects Elongated Spherical 2D objects Non homogeneous object Homogeneous object
Steps involved in characterization 1.Obtain the center of mass of the region. Note that in the case of the non-homogeneous regions the center of mass is calculated using a weighted contribution of each voxel of the region, based on the value. 2.Using the center of mass as the center,construct a series of 1..k concentric spheres in 3D(circles in 2D) with regular increments of their radius 3.For each sphere(or circle) measure features such as (a)the fraction of the sphere(or circle) occupied by the region (b) The fraction of the region occupied by the sphere(circle) forming respectively feature vectors f s and f r of size k.
Intersecting concentric spheres with the ROI being characterized Sample characterization vectors w.r.t object [3.52941 8.23529 14.5098 22.3529 38.0392 50.5882 68.6275 82.7451 94.5098 99.2157 100 100 100 100] [3 7 12.3333 19 32.3333 43 59 72.6667 86.6667 97.3333 99.3333 100 100 100 ] Sample characterization vectors w.r.t circle [100 100 100 100 100 100 98.8701 95.4751 87.0036 72.4928 62.3472 52.1472 44.8155 38.8128 ] [ 100 100 100 100 100 100 100 98.6425 93.8628 83.6676 72.8606 61.3497 52.7241 45.]
A plot of the feature vectors (f r) of spherical and elongated ROI
Experimental Results We simulate homogeneous and non-homogeneous elongated and spherical objects in 3D and 2D. Calculation of Euclidean distances for 2D Homogeneous and Non-Homogeneous ROIs Homogeneous ROIs Non-Homogeneous ROIs
Euclidean distances of feature vectors fr and fs between all pairs of elongated and Spherical 3D homogeneous regions. Euclidean distances of feature vectors between all pairs of non-homogeneous elongated objects
Comparison of the method with the Morphological approach Morphological Distance between the Non Binary 3D as compared to all other 3D objects (a) (b) Euclidean distances of Non Binary 3D objects obtained using (a) feature vector f r and (b) feature vector f s
Work in progress • Using Statistical Methods for obtaining the most discriminative radius for characterization(work being done with Dr Marc Sobel, Department of Statistics, Temple University) • Using Dimensionality Reduction Techniques – Singular Value Decomposition and Karhunen Loeve Transform • Extension of the method of characterization so that it can be applied to non homogeneous objects with more than one initial growing points • Testing the performance of this characterization method at the classification stage with the use of neural networks , decision trees, bayesian classfiers.