Download
1 / 69
700 likes | 865 Vues
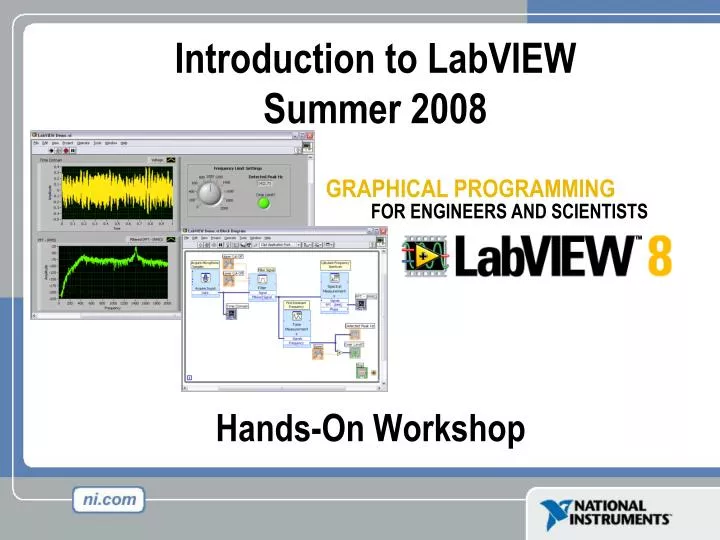
Introduction to LabVIEW Summer 2008. Hands-On Workshop. GRAPHICAL PROGRAMMING. FOR ENGINEERS AND SCIENTISTS. The Virtual Instrumentation Approach. LabVIEW Graphical Development System. Graphical Programming Environment Compile code for multiple OS and devices

E N D
Introduction to LabVIEWSummer 2008 Hands-On Workshop GRAPHICAL PROGRAMMING FOR ENGINEERS AND SCIENTISTS
LabVIEW Graphical Development System • Graphical Programming Environment • Compile code for multiple OS and devices • Useful in a broad range of applications
Design Prototype Deploy Virtual Instrumentation Applications • Design • Signal and Image Processing • Embedded System Programming • (PC, DSP, FPGA, Microcontroller) • Simulation and Prototyping • And more… • Control • Automatic Controls and Dynamic Systems • Mechatronics and Robotics • And more… • Measurements • Circuits and Electronics • Measurements and Instrumentation • And more… A single graphical development platform
Laptop PC PXI Modular Instrumentation PDA Desktop PC High-Speed Digitizers Counter/ Timers Distributed I/O and Embedded Control High-Resolution Digitizers and DMMs Multifunction Data Acquisition Dynamic Signal Acquisition Instrument Control Machine Vision Motion Control Digital I/O Signal Conditioning and Switching Unit Under Test The NI Approach – Integrated Hardware Platforms
Section I – LabVIEW Environment A. Getting Data into your Computer • Data Acquisition Devices • NI-DAQ • Simulated Data Acquisition • Sound Card B. LabVIEW Environment • Front Panel / Block Diagram • Toolbar /Tools Palette C. Components of a LabVIEW Application • Creating a VI • Data Flow Execution D. Additional Help • Finding Functions • Tips for Working in LabVIEW
A. Setting Up Your Hardware • Data Acquisition Device (DAQ) • Actual USB, PCI, or PXI Device • Configured in MAX • Simulated Data Acquisition Device (DAQ) • Software simulated at the driver level • Configured in MAX • Sound Card • Built into most computers Track A Track B Track C
What type of device should I use? * The above table may not be representative of all device variations that exist in each category
What is MAX? • MAX stands for Measurement & Automation Explorer. • MAX configures and organizes all your National Instruments DAQ, PCI/PXI instruments, GPIB, IMAQ, IVI, Motion, VISA, and VXI devices. • Used for configuring and testing devices. Icon Found on Windows Desktop
Exercise 1 – Setting Up Your Device Track A • Use Measurement and Automation Explorer (MAX) to: • Configure and test your Data Acquisition (DAQ) device
Exercise 1 – Setting Up Your Device Track B • Use Measurement and Automation Explorer (MAX) to: • Configure and test your Simulated Data Acquisition (DAQ) device
Exercise 1 – Setting Up Your Device Track C • Use Windows to: • Verify your Sound Card Un-Mute Microphone
Open and Run LabVIEW Start»All Programs»National Instruments LabVIEW 8.0 » Startup Screen: Start from a Blank VI: New»Blank VI Start from an Example: Examples»Find Examples… or
LabVIEW Programs Are Called Virtual Instruments (VIs) • Each VI has2 Windows • Front Panel • User Interface (UI) • Controls = Inputs • Indicators = Outputs • Block Diagram • Graphical Code • Data travels on wires from controls through functions to indicators • Blocks execute by Dataflow
Controls Palette(Controls & Indicators) (Place items on the Front Panel Window) Control: Numeric Customize Palette View Indicator: Numeric Slide
Functions (and Structures) Palette (Place items on the Block Diagram Window) Structure: While Loop
Status Toolbar Run Button Continuous Run Button Abort Execution Additional Buttons on the Diagram Toolbar Execution Highlighting Button Retain Wire Values Button Step Function Buttons
Demonstration 1: Creating a VI Front Panel Window Graph Indicator Block Diagram Window Output Terminal Boolean Control Input Terminals
Dataflow Programming • Block diagram execution • Dependent on the flow of data • Block diagram does NOT execute left to right • Node executes when data is available to ALL input terminals • Nodes supply data to all output terminals when done
Debugging Techniques • Finding Errors • Execution Highlighting • Probes Click on broken Run button. Window showing error appears. Click on Execution Highlighting button; data flow is animated using bubbles. Values are displayed on wires. Right-click on wire to display probe and it shows data as it flows through wire segment. You can also select Probe tool from Tools palette and click on wire.
Exercise 2 – Acquiring a Signal with DAQ Track A&B • Use a LabVIEW template to: • Acquire a signal from your DAQ device This exercise should take 15 minutes.
Exercise 2 – Acquiring a Signal with the Sound Card Track C • Use LabVIEW to: • Acquire a signal from your sound card This exercise should take 15 minutes.
Context Help Window • Help»Show Context Help, press the <Ctrl+H> keys • Hover cursor over object to update window • Additional Help • Right-Click on the VI icon and choose Help, or • Choose “Detailed Help.” on the context help window
Tips for Working in LabVIEW • Keystroke Shortcuts • <Ctrl+H> – Activate/Deactivate Context Help Window • <Ctrl+B> – Remove Broken Wires From Block Diagram • <Ctrl+E> – Toggle Between Front Panel and Block Diagram • <Ctrl+Z> – Undo (Also in Edit Menu) • Tools»Options… – Set Preferences in LabVIEW • VI Properties–Configure VI Appearance, Documentation, etc.
Section II – Elements of Typical ProgramsLectures 3,4,5 and 6 A. Loops • While Loop • For Loop B. Functions and SubVIs • Types of Functions • Creating Custom Functions (SubVI) • Functions Palette & Searching C. Decision Making and File IO • Case Structure • Select (simple If statement) • File I/O
Loops While Loop • While Loops • i terminal counts iteration • Always runs at least once • Runs until stop condition is met For Loop • For Loops • i terminal counts iterations • Run according to input N of count terminal
Drawing a Loop 2. Enclose code to be repeated 1. Select the structure 3. Drop or drag additional nodes and then wire
3 Types of Functions (from the Functions Palette) • Express VIs: interactive VIs with configurable dialog page (blue border) • Standard VIs: modularized VIs customized by wiring(customizable) • Functions: fundamental operating elements of LabVIEW; no front panel or block diagram (yellow)
What Types of Functions are Available? • Input and Output • Signal and Data Simulation • Acquire and Generate Real Signals with DAQ • Instrument I/O Assistant (Serial & GPIB) • ActiveX for communication with other programs • Analysis • Signal Processing • Statistics • Advanced Math and Formulas • Continuous Time Solver • Storage • File I/O Express Functions Palette
Searching for Controls, VIs, and Functions • Palettes are filled with hundreds of VIs • Press the search button to index the all VIs for text searching • Click and drag an item from the search window to the block diagram • Double-click an item to open the owning palette
Create SubVI • Enclose area to be converted into a subVI. • Select Edit»Create SubVI from the Edit Menu.
LabVIEW Functions and SubVIs operate like Functions in other languages Function Pseudo Code function average (in1, in2, out) { out = (in1 + in2)/2.0; } SubVI Block Diagram Calling Program Pseudo Code main { average (in1, in2, pointavg) } Calling VI Block Diagram
Exercise 3.1 – Analysis Track A,B,&C • Use LabVIEW Express VIs to: • Simulate a signal and display its amplitude and frequency This exercise should take 15 minutes.
Exercise 3.2 – Analysis Track A&B • Use LabVIEW Express VIs to: • Acquire a signal and display its amplitude and frequency This exercise should take 15 minutes.
Exercise 3.2 – Analysis Track C • Use LabVIEW Express VIs to: • Acquire a signal and display its amplitude and frequency This exercise should take 15 minutes.
How Do I Make Decisions in LabVIEW? • Case Structures • Select (b) (a) (c)
File I/O File I/O – passing data to and from files • Files can be binary, text, or spreadsheet • Write/Read LabVIEW Measurements file (*.lvm) Writing to LVM file Reading from LVM file
Exercise 3.3 – Decision Making and Saving Data Track A,B,C • Use a case structure to: • Make a VI that saves data when a condition is met This exercise should take 15 minutes.
File I/O Programming Model – Under the hood Open/Create/Replace File Read and/orWrite to File Close File Check for Errors
Section III – Presenting your Results A. Displaying Data on the Front Panel • Controls and Indicators • Graphs and Charts • Loop Timing B. Signal Processing • MathScript • Arrays • Clusters • Waveforms
What Types of Controls and Indicators are Available? • Numeric Data • Number input and display • Analog Sliders, Dials, and Gauges • Boolean Data • Buttons and LEDs • Array & Matrix Data • Numeric Display • Chart • Graph • XY Graph • Intensity Graph • 3D graph: point, surface, and model • Decorations • Tab Control • Arrows • Other • Strings and text boxes • Picture/Image Display • ActiveX Controls Express Controls Palette
Charts – Add 1 data point at a time with history Waveform chart – special numeric indicator that can display a history of values • Chart updates with each individual point it receives Functions»Express»Graph Indicators»Chart
Graphs – Display many data points at once • Waveform graph – special numeric indicator that displays an array of data • Graph updates after all points have been collected • May be used in a loop if VI collects buffers of data Functions»Express»Graph Indicators»Graph
Building Arrays with Loops (Auto-Indexing) Auto-Indexing Enabled • Loops can accumulate arrays at their boundaries with auto-indexing • For Loops auto-index by default • While Loops output only the final value by default • Right-click tunnel and enable/disable auto-indexing Wire becomes thicker 1D Array 0 1 2 3 4 5 Auto-Indexing Disabled Wire remains the same size Only one value (last iteration) is passed out of the loop 5
Creating an Array (Step 1 of 2) From the Controls»Modern»Array, Matrix, and Cluster subpalette, select the Array icon. Drop it on the Front Panel.
Create an Array (Step 2 of 2) • Place an Array Shell. • Insert datatype into the shell (i.e. Numeric Control).
How Do I Time a Loop? 1. Loop Time Delay • Configure the Time Delay Express VI for seconds to wait each iteration of the loop (works on For and While loops). 2. Timed Loops • Configure special timed While loop for desired dt. Time Delay Timed Loop
Control & Indicator Properties • Properties are characteristics or qualities about an object • Properties can be found by right clicking on a Control or Indicator • Properties Include: • Size • Color • Plot Style • Plot color • Features include: • Cursors • Scaling
Exercise 4.1 – Manual Analysis Track A,B,&C • Use the cursor legend on a graph to: • Verify your frequency and amplitude measurements This exercise should take 15 minutes.
Textual Math in LabVIEW • Integrate existing scripts with LabVIEW for faster development • Interactive, easy-to-use, hands-on learning environment • Develop algorithms, explore mathematical concepts, and analyze results using a single environment • Freedom to choose the most effective syntax, whether graphical or textual within one VI Supported Math Tools: MathScript script node MathSoft software Mathematica software MATLAB® software Maplesoftware Xmathsoftware MATLAB ® is a registered trademark of The MathWorks, Inc.