Download
1 / 38
400 likes | 1.73k Vues
Merchandise Inventory, Cost of Goods Sold, and Gross Profit Chapter 6 Income Statements Service Company Century 21 Real Estate Income Statement Year Ended December 31, 20xx Merchandising Company General Motors Corporation Income Statement Year Ended December 31, 20xx

E N D
Merchandise Inventory, Cost of Goods Sold, and Gross Profit Chapter 6
Income Statements Service Company Century 21 Real Estate Income Statement Year Ended December 31, 20xx Merchandising Company General Motors Corporation Income Statement Year Ended December 31, 20xx Service revenue $XXX Expenses Salary expense X Depreciation expense X Income tax expense X Net income $ X Sales revenue $185 Cost of goods sold 146 Gross profit 39 Operating expenses: Salary expense X Depreciation expense X Income tax expense $ X Net income $ 4 ©2006 Prentice Hall Business Publishing Financial Accounting, 6/e Harrison/Horngren
Balance Sheets Service Company Century 21 Real Estate Balance Sheet Year Ended December 31, 20xx Merchandising Company General Motors Corporation Balance Sheet Year Ended December 31, 20xx Current assets: Cash $X Short-term investments X Accounts receivable, net X Prepaid expenses X Current assets: Cash $ X Short-term investments X Accounts receivable, net X Inventory 11 Prepaid expenses X ©2006 Prentice Hall Business Publishing Financial Accounting, 6/e Harrison/Horngren
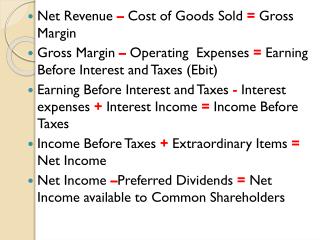
Gross Profit (Gross Margin) Sales Revenue - Gross Profit - Operating Expenses Net Income
Learning Objective 1 Account for inventory transactions.
Inventory Accounting Systems • Periodic systems do not keep a continuous record of inventory on hand. • Perpetual systems maintain a running record to show the inventory on hand at all times.
Recording Transactionsin the Perpetual System Purchase price of the inventory $600,000 + Freight-in 4,000 – Purchase returns – 25,000 – Purchase allowances – 5,000 – Purchase discounts – 14,000 = Net purchases of inventory $560,000
Inventory Accounts Payable Beg. 100,000 560,000 560,000 Recording Transactionsand the T-Accounts Inventory 560,000 Accounts Payable 560,000 Purchased inventory on account ©2006 Prentice Hall Business Publishing Financial Accounting, 6/e Harrison/Horngren
Recording Transactionsand the T-Accounts Sale on account $900,000 (cost $540,000): Accounts Receivable 900,000 Sales Revenue 900,000 Cost of Goods Sold 540,000 Inventory 540,000 ©2006 Prentice Hall Business Publishing Financial Accounting, 6/e Harrison/Horngren
Cost of Goods Sold 540,000 Recording Transactionsand the T-Accounts Inventory Beg. 100,000 560,000 120,000 540,000
Reporting in theFinancial Statements Income Statement (partial) Sales revenue $900,000 Cost of goodssold 540,000 Gross profit $360,000 Ending Balance Sheet (partial) Current assets: Cash $ XXX Short-term investments XXX Accounts receivable, net XXX Inventory 120,000 Prepaid expenses XXX
Reporting in theFinancial Statements Net purchases Purchases + Freight-in – Purchase returns & allowances – Purchases discount Net sales Sales revenue – Sales returns & allowances – Sales discounts
Learning Objective 2 Analyze the various inventory methods.
What Goes Into Inventory Cost? • Sum of all costs incurred to bring asset to its intended use • Inventory costing methods: • Specific unit cost • Weighted-average cost • First-in, first-out (FIFO) • Last-in, first-out (LIFO)
Illustrative Data Beginning inventory (10 units @ $10) $ 100 No. 1 (25 units @ $14 per unit) $350 No. 2 (25 units @ $18 per unit) 450 Total purchases 800 Cost of goods available for sale $ 900 Ending inventory: 20 units Cost of goods sold: 40 units
5 Units @ $10 25 Units @ $14 10 Units @ $18 Specific Unit Cost Cost of Goods Sold $ 50 350 180 $580 $900 – $580 = $320
Weighted-Average $900 total cost ÷ 60 units = $15/unit Ending inventory = 20 × $15 = $300 Cost of goods sold = 40 × $15 = $600
First-In, First-Out Ending Inventory Cost: 60 units Less units sold 40 Ending inventory 20 units 20 units × $18 per unit = $360
First-In, First-Out 10 Units @ $10 Cost of Goods Sold $100 350 90 $540 25 Units @ $14 5 Units @ $18
Last-In, First-Out Ending Inventory Cost: 60 units Less units sold 40 Ending inventory 20 units 10 units × 10 = $100 10 units × 14 = 140 Total $240
Last-In, First-Out Cost of Goods Sold $450 210 $660 25 Units @ $18 15 Units @ $14
Income Effects ofInventory Methods Assumed Sales Revenue Cost of Goods Sold Gross Profit Specific unit cost $1,000 – 580 = $420 Weighted-average $1,000 – 600 = $400 FIFO $1,000 – 540 = $460 LIFO $1,000 – 660 = $340 ©2006 Prentice Hall Business Publishing Financial Accounting, 6/e Harrison/Horngren
Learning Objective 3 Identify the income and the tax effects of the inventory methods.
FIFO LIFO Gross profit $460 $340 Operating expenses 260 260 Income before taxes $200 $ 80 Income tax expense (40%) $ 80 $ 32 The Tax Advantage of LIFO The most attractive feature of LIFO is low income tax payments when prices are increasing.
Comparison of Inventory Methods • FIFO produces inventory profits during periods of inflation • LIFO allows managers to manipulate net income • LIFO liquidation
Consistency Principle • Use the same accounting methods and procedures from one period to the next • May change inventory methods, but must disclose the effects of the change on net income
Disclosure Principle • Financial statements should report enough information to enable an outsider to make knowledgeable decisions about the company.
Conservatism • The least favorable figures are presented in the financial statements.
Lower-of-Cost-or-Market Rule • Report inventory at the lower of its historical cost or market (replacement) value • If the replacement cost falls below its historical cost, write down the value of the inventory
Learning Objective 4 Use the gross profit percentage and inventory turnover to evaluate business.
Using the Financial Statementsfor Decision Making Gross profit percentage = Gross profit ÷ Net sales revenue Inventory turnover = Cost of goods sold ÷ Average inventory
Learning Objective 5 Estimate inventory by the gross profit method.
Beginning inventory + Purchases = Cost of goods available for sale – Ending inventory = Cost of goods sold Estimating Inventory Gross profitmethod - based on computation of cost-of-goods-sold - Cost of goods sold = Ending inventory
Objective 6 Show how inventory errors affect cost of goods sold and income.
Effects of Inventory Errors • An error in the ending inventory creates errors for cost of goods sold and gross profit. • The current year’s ending inventory is next year’s beginning inventory.
Reporting Inventory Transactions on the Statement of Cash Flows • Inventory transactions are operating activities • The purchase of inventory requires a cash payment, and the sale a cash receipt