Download
1 / 16
170 likes | 1.19k Vues
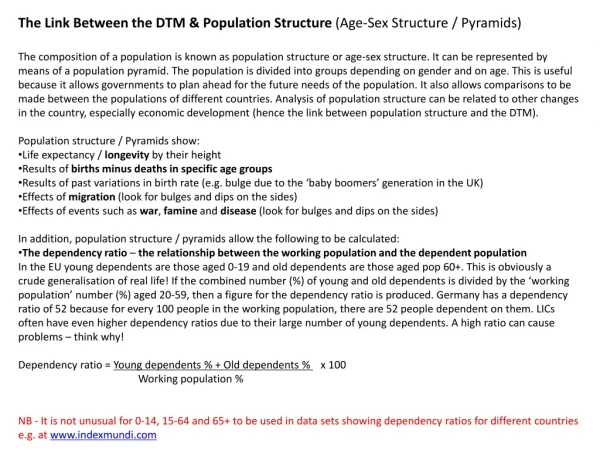
Population Age Structure. Why is age structure important? How is age structure measures? What determines age structure?. Importance of age structure. Demographic bonus: Age-earnings profile Lifecycle saving: C and Y, Taiwan Fiscal policy: US (Lee and Edwards 2001).

E N D
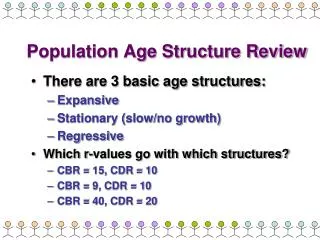
Population Age Structure • Why is age structure important? • How is age structure measures? • What determines age structure?
Importance of age structure • Demographic bonus: Age-earnings profile • Lifecycle saving: C and Y, Taiwan • Fiscal policy: US (Lee and Edwards 2001)
II. Measuring Age Structure • Age distribution • Mean age • Dependency ratio or support ratio
Age distribution • Age pyramid: Hawaii • Age distribution: Hawaii f(a,t) = N(a,t)/N(t) • Mean Age and dependency ratio: Hawaii DR=Dependent pop/Working age pop
III. Determinants of age structure • Stable population • Over the demographic transition • Immigration
Stable Population • A population which has been subject to constant age-specific birth and death rates for an extended period of time. • Once stability is achieved: • Population growth is constant • Age distribution is constant • All age groups grow at the same rate • Stationary population is stable population with n=0
Stable Case (cont) Where: n = population growth rate B = number of births s = proportion surviving from birth to age a N = population
Age Distributions for Stable Populations High Mortality Population (early Hawaii) Low Mortality Population (current US)
Demographic Transition and Age Distribution of the Population • Age structure is determined both by birth rates and survival rates • High TFR leads to young age structure • Effect of e0 varies over the transition • Early in transition, increase in e0 leads to even younger population (gains are at young ages) • Later in transition, increase in e0 leads to older population (gains are at older ages)
Demographic Transition and 3 Phases of Age Distribution • Phase I: Percent under 15 rises. • Phase II: Percent under 15 declines and percent 15-64 rises. • Phase III: Percent 15-64 declines and percent 65+ rises. • The swings in age-structure depend on how rapidly fertility and mortality change.
Working-Age Population3 Asian Countries Japan China India
Immigration and aging • Immigration often reduces average age of population • Immigrants tend to be young adults • Immigrants have children • Immigration is not a solution to the aging problem (UN Replacement Migration 2001)