Download
1 / 39
390 likes | 704 Vues
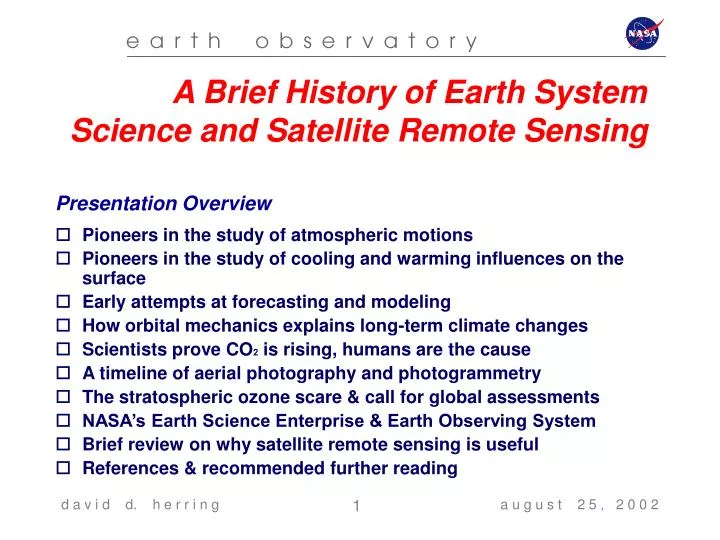
A Brief History of Earth System Science and Satellite Remote Sensing. Pioneers in the study of atmospheric motions Pioneers in the study of cooling and warming influences on the surface Early attempts at forecasting and modeling How orbital mechanics explains long-term climate changes

E N D
A Brief History of Earth System Science and Satellite Remote Sensing • Pioneers in the study of atmospheric motions • Pioneers in the study of cooling and warming influences on the surface • Early attempts at forecasting and modeling • How orbital mechanics explains long-term climate changes • Scientists prove CO2 is rising, humans are the cause • A timeline of aerial photography and photogrammetry • The stratospheric ozone scare & call for global assessments • NASA’s Earth Science Enterprise & Earth Observing System • Brief review on why satellite remote sensing is useful • References & recommended further reading Presentation Overview a u g u s t 2 5 , 2 0 0 2
Pioneers in Atmospheric Motions • Edmond Halley (1656-1742), British astronomer 1 • Drew the first documented map of the known trade winds, circa 1686 • Although Halley clearly showed the proper trade winds, Halley had trouble describing the physics behind them. Halley used the laws of buoyancy to try to describe the phenomena he witnessed. When air is heated, it rises and as it rises, more air must flow inwards to make up for the void. Halley knew of the rotation of the Earth and surmised that the incoming air had to move from the east to compensate. a u g u s t 2 5 , 2 0 0 2
Pioneers in Atmospheric Motions • George Hadley (1685-1768), English lawyer & scientist 2 • “I think the causes of the General Trade-Winds have not been fully explained by any of those who have wrote on that subject.” (1735) • In 1735, Hadley expounded upon the ideas of Halley. Instead of simple currents traveling east, he envisioned a Coriolis acceleration that is latitude dependent. • He also envisioned an "anti-trade" wind that blew to the northeast above the surface southeast trades and found that the mid-latitude westerly got their eastward velocity from sinking dense and fast air from aloft. These ideas still hold valid today. • First to describe tropical circulation in 1753. He envisaged the heat surplus of the equatorial regions driving large-scale circulation cells consisting of air rising in the tropics and then sinking 30 degrees north and south. This sinking air would then flow back towards the equator. His simple idea was to become the basis of the general circulation of the atmosphere as it is understood today. • Both men agreed upon the idea of upper tropospheric meridional circulations. They knew that the equatorial region would have the highest temperature and therefore the updrafts in this region would form large convective, unstable regions. As the air flowed vertically, the divergence in the upper troposphere would split up and travel to the northern and southern poles. When the circulations eventually reached the colder regions, the air would become denser, form a downdraft and return to the equatorial regions along the surface. Although Hadley understood about the Coriolis acceleration, his idea (along with Halley’s) about one cell in each of the hemispheres was not correct. a u g u s t 2 5 , 2 0 0 2
Pioneers in Atmospheric Motions • George Hadley • The area where both Hadley Cells met along the equator was a region of large instability and created large convective clouds. This region is called the InterTropical Convergent Zone (ITCZ), the convergence describing the surface inflow of air. The flow to the higher latitudes gained energy & would eventually rise at locations close to latitudes of 60 degrees. This rising air behaved similar to the rising area at the ITCZ, creating a region of low pressure and producing regions of higher precipitation. Again, the rising air would diverge and produce the final polar cell. a u g u s t 2 5 , 2 0 0 2
An Enlightened American • Benjamin Franklin (1706-1790), U.S. founding father and experimental scientist 3 • Franklin suspected that lightning was an electrical current in nature, and he wanted to test this idea. One way would be to see if the lightning would pass through metal. In 1752 he conducted his famous experiment by flying a key on a kite string during an electrical storm. • He knew lightning was powerful & dangerous & invented the lightning rod to protect ships & buildings • In 1743, he observed that northeast storms begin in the southwest and thought it odd that storms travel in an opposite direction to their winds. He predicted that a storm's course could be plotted. He later rode a horse through a storm and chased a whirlwind three- quarters of a mile in order to learn more about storms. • Franklin’s political appointments took him often to Europe. On one such voyage he observed the warm Gulf Stream waters by the temperature of the wine stored in the ship’s hull. On a subsequent voyages, he mapped the Gulf Stream and recorded its surface temperatures and current speeds. a u g u s t 2 5 , 2 0 0 2
Two of Nature’s Cooling Influences • In 1794, Franklin wrote about Europe’s constant ‘dry fog’ • He wrote that it so dissipated the sun's ray's that "when collected in the focus of a burning glass, they would scarce kindle brown paper.” • Franklin correctly attributed the dry fog to a large Icelandic volcano that erupted in 1783, and he argued that the reduced solar heating was the cause of unusual cold in 1783-84. • Franklin discussed the concept of the climate feedback that would result from increased snow cover. He understood brighter surfaces have greater reflectance, therefore exerting a cooling influence a u g u s t 2 5 , 2 0 0 2
Why is the Earth So Warm? • Jean Baptiste Joseph Fourier (1768-1830), French mathematician 4,5 • • Became interested in dissipation of heat while serving Napoleon in Egypt. Proposed that the Earth’s atmosphere behaves like a “hothouse” • He misunderstood how a hothouse works, and assumed that the glass let in the sun's infrared rays and reflected heat back into the structure • Experimented on rate of cooling of a uniformly heated sphere. He approached this by heating a small polished iron sphere, then allowing it to cool. He found that varying the method of heating had little effect, while blackening the surface would approximately double the cooling rate. • Transcending his theories on heat, his equations became the foundation for climate modeling today a u g u s t 2 5 , 2 0 0 2
Light Scattering & Absorption • John Tyndall (1820-1893), natural philosopher born in Ireland 6,7 • Credited for founding the science of light scattering or nephelometry. His instruments are the basis of many instru- ments that atmospheric scientists use today such as fluorimeters, turbimeters and ultra- violet spectrometers. • His major research was in the transmission and absorption of gases, liquids and vapors, thus laying the basis for infrared spectroscopy. • Investigated radiant heat in1859. He built the first ratio spectrophotometer to measure the absorptive powers of gases such as water vapor, carbon dioxide, ozone and hydro- carbons (many of the greenhouse gases). • Demonstrated that water vapor, carbon dioxide and ozone are some of the best absorbers of heat radiation a u g u s t 2 5 , 2 0 0 2
Earth’s Absorptive Atmosphere • John Tyndall • Concluded water vapor Is the strongest absorber of radiant heat and is the most important gas controlling the Earth’s surface air temperature. • Speculated on how changes in water vapor and carbon dioxide could be related to climate change. a u g u s t 2 5 , 2 0 0 2
Earth’s Absorptive Atmosphere • John Tyndall • He wrote that without water vapor, Earth’s atmosphere would be “held fast in the iron grip of frost.” • Tyndall related his studies to the minimum nighttime temperatures and the formation of dew, correctly noting that dew and frost are caused by a loss of heat through radiative processes. Even saw London as a “heat island” warmer than its surroundings due to greater thermal radiation. • Tyndall is credited with the first ever atmospheric pollution measurement using infrared and scattering measurement instruments to monitor the atmosphere. • He discovered the Tyndall effect—the diffusion of light by large molecules and dust. Though he could not explain it theoretically, he first suggested that the reason the sky is blue is due to the scattering of the suns rays by molecules in the atmosphere • Tyndall also showed that ozone was an oxygen cluster rather than a hydrogen compound. a u g u s t 2 5 , 2 0 0 2
Measuring Temperatures Remotely • Samuel Langley (1834-1906), American physicist & engineer 12,13 • Invented the bolometer in 1878 (refined in 1880), which was based on the principle that electrical resistivity is affected by temperature. Composed of two thin strips of metal, a Wheatstone bridge, a battery and a galvanometer (an electrical current measuring device), the bolometer was sensitive to differences in temperature of one hundred-thousandth of a degree Celsius (.00001 C). The Bolometer a u g u s t 2 5 , 2 0 0 2
Mapping the Solar Spectrum • Samuel Langley • With the bolometer he was able to “map” the infrared portion of the solar and lunar spectrum with unprecedented accuracy. • With the spectrobolometer, Langley found the highest temperature of the Moon was about 0°C, and the lowest temperature not far from the temperature of space • Langley became deeply interested in the problem of variable solar radiation. He found that the solar constant is variable in 1904. i.e. the sun’s radiation changes over time. He also studied sunspots and tried to discern their effects on the Earth • Langley was also a pioneer in aviation • Did experiments in lift and was the first to explain how birds soar and glide without appreciable wing movement. • In 1896 Langley became the first to build heavier-than-air machines capable of unmanned and uncontrolled, but sustained flight. The first flight went 914 meters and the second 1280 meters. They used steam engines and had a wingspan of about 14 feet. a u g u s t 2 5 , 2 0 0 2
The First Global Climate Model • Svante Arrhenius (1859-1927), Swedish physicst 14Theorized atmospheric CO2rising in atmosphere due to human industry; predicted doubling CO2 would increase average global temperature by ~ 5°C a u g u s t 2 5 , 2 0 0 2
Early Weather Forecasting • Sir Gilbert Walker, British mathematician 8,9 • As head of the Indian Meteorological Service, was asked in 1904 to predict the vagaries of India's monsoons after an 1899 famine caused by monsoon failure • He noticed a seesaw relationship between atmospheric pressure in the eastern South Pacific (east of Tahiti) and the Indian Ocean (west of Darwin, Australia)—that is, if pressure was high in one region, it was usually low in the other and vice versa. • In 1928, Walker named this seesaw pattern the “Southern Oscillation” and began tracking pressure differences between the two regions. He found when pressure was very high in the east and low in the west, the monsoon rains in India were heavy. When the pressure difference was small, the rains failed and drought often ensued. a u g u s t 2 5 , 2 0 0 2
Early Weather Forecasting • Sir Gilbert Walker • His data showed that drought conditions hit not only Australia, Indonesia, and India but also parts of sub-Saharan Africa, while there would be mild winters in Canada. a u g u s t 2 5 , 2 0 0 2
Atmospheric Circulation • Sir Gilbert Walker • His research showed that drought conditions hit not only Australia, Indonesia, and India but also parts of sub-Saharan Africa, and at the same time there would be mild winters in Canada. • Despite his insight and vision, Walker was unable to identify the physical processes responsible for the Southern Oscillation, and for the next three decades numerous factors conspired to dampen further research on the phenomenon. Chief among them was that from 1930 to 1950 the climate signals marking the Southern Oscillation and El Niño were much less pronounced than they had been, and interest in the subject dropped off. • Walker was publicly criticized for suggesting that climatic conditions over such widely separated regions of the globe could be linked. Walker conceded that he couldn't prove his theory, but predicted that whatever was causing the connection in weather patterns would become clear once wind patterns above ground level, which were not routinely being observed at that time, were thrown into the equation. a u g u s t 2 5 , 2 0 0 2
Numerical Weather Modeling • Vilhelm Bjerknes (1862-1951), Norwegian physicist & mathematician 10 • His father was a scientist; at the age of 7, young Vilhelm worked with his father on his experiments in hydrodynamics. These experiences together with his college degrees led him to begin research on applying hydrodynamics and thermodynamics to large-scale motions in the atmosphere and oceans. • He was the first to propose what is called today “numerical weather modeling,” which approached forecasting using a mathematical technique called the “initial value problem,” where multiple mathematical equations describing atmospheric processes are integrated forward in time based on the current or “initial” state of the atmosphere. • Due to lack of computational capacity, the calculations he envisioned were not feasible at that time. Nevertheless, Bjerknes considered weather forecasting as the principal objective of meteorological research. • Bjkernes and his son together installed weather stations all across Norway, the data from which led to the development of their theory of Polar fronts. They put forward the theory that weather activity is concentrated in relatively narrow zones, which form the boundaries between warm and cold air masses. They called these zones "fronts," an analogy with the First World War battlefronts. a u g u s t 2 5 , 2 0 0 2
Atmospheric Circulation • Jacob Bjerknes 11 • Bjerknes refered to the oceanic and atmospheric circulation over the tropical Pacific as a "chain reaction". He wrote "An intensifying Walker Circulation also provides for an increase of east-west temperature contrast that is the cause of the Walker Circulation in the first place." Bjerknes also noted that the interaction could operate in the opposite: a decrease in the equatorial easterlies diminishes the supply of upwelling cold water and the lessened east-west temperature gradient causes the Walker Circulation to slow down. He thus provided an explanation for the association of the low phase of the Southern Oscillation with El Niño as well as the association of the high phase with normal cold state of the eastern Pacific. a u g u s t 2 5 , 2 0 0 2
Earth’s Orbital Mechanics • Milutin Milankovitch (1879-1958), Serbian astrophysicist 15,16 • First known for his bridge work, Milankovitch was interned during WWI and during this time first began to formulate his theories relating Earth’s motions and long-term climate change • A mathematical theory of climate based on the seasonal and latitudinal variations of solar radiation received by the Earth • Milankovitch Theory states that as the Earth travels around the sun, cyclical variations in three elements of Earth-sun geometry combine to produce variations in the amount of solar energy that reaches Earth: (1) Variations in the Earth's orbital eccentricity—the shape of the orbit around the sun. a u g u s t 2 5 , 2 0 0 2
Earth’s Orbital Mechanics • Milutin Milankovitch (2) Changes in obliquity—changes in the angle that Earth's axis makes with the plane of Earth's orbit. (3) Precession—the change in the direction of the Earth's axis of rotation, i.e., the axis of rotation behaves like the spin axis of a top that is winding down; hence it traces a circle on the celestial sphere over a period of time. a u g u s t 2 5 , 2 0 0 2
Earth’s Orbital Mechanics • Milutin Milankovitch • Using these three orbital variations, Milankovitch formulated a mathematical model that calculated latitudinal differences in insolation and the corresponding surface temperature for 600,000 years prior to the year 1800. He then correlated these changes with the growth and retreat of the Earth’s Ice Ages. • Though his first monograph on the subject was published in 1920, it was alternately ignored and refuted for about 50 years. As with many areas of science, theories predated that observational evidence. It wasn’t until 1976, when a study published in the journal Science examined deep-sea sediment cores over 450,000 revealed the relationship. a u g u s t 2 5 , 2 0 0 2
20th Century Focus on Carbon Dioxide • Roger Revelle (1909-1991), U.S. Oceanographer 17,18 • Interested in the air-sea interface and the draw-down of carbon dioxide into the deep ocean. Searched for the saturation points and rates • In 1957, Revelle and Hans Suess, one of the founders of radiocarbon dating, demonstrated that carbon dioxide had increased in the air as a result of the use of fossil fuels in a famous article published in Tellus, a European meteorology and oceanography journal. Under Revelle's leadership, the first authoritative U.S. government report published in which carbon dioxide from fossil fuels was officially recognized as a potential global problem. • •Revelle chaired the National Academy of Sciences Energy and Climate Panel in 1977, which found that about forty percent of the anthropogenic carbon dioxide has remained in the atmosphere, two-thirds of that from fossil fuel, and one-third from the clearing of forests. • Revelle and Suess wrote their seminal paper (3) with the now legendary phrase "human beings are now carrying out a large scale geophysical experiment" that so captured the imagination of large numbers of scientists. a u g u s t 2 5 , 2 0 0 2
20th Century Focus on Carbon Dioxide • Charles David Keeling, U.S. atmospheric chemist • Began measuring CO2 levels in mid-1950s • Measured 314 ppm in 1958, which he compared to George Callendar’s calculation of the 1900 levels of CO2 at 290 ppm • Keeling published his results in 1959 • While the overall trend continues upward, note the annual rise and fall, which illustrates our world’s biosphere “inhaling and exhaling” a u g u s t 2 5 , 2 0 0 2
Aerial Photography & Photogrammetry 19 • In 1839, the first ever photos were taken in France by Daguerre and Nepce. By 1840, the French were using photos to produce topographic maps. • In 1858, the first aerial photos were taken of Paris by cameras mounted in a hot air balloon. There are claims that aerial reconnaissance was used during the American Civil War by hot air balloon-mounted cameras. (Perhaps, but no images survive today.) • In the 1880s, the British flew cameras mounted onto kites. • In 1903, small cameras were fixed onto carrier pigeons. • In 1909, Wilbur Wright shot the first photos from an airplane in flight. In 1915, the British RAF collected aerial reconnaissance photos during World War I. • In 1930, the first aerial spectrophotography of the Earth was collected by Krinov and colleagues in Russia. • Infrared film first tested in 1931, dramatic advances made in 1940s. a u g u s t 2 5 , 2 0 0 2
Space-based Photography • The first space-based photo taken March 7, 1947 • Taken 100 miles above New Mexico, U.S., while testing captured German V-2 rockets • This photo was taken by an automatic K-12 camera, using black and white infrared film, from a Viking sounding rocket that reached a height of 227 km (141 miles). This scene spans across parts of New Mexico, Arizona, Nevada, California, & northwest Mexico (upper Gulf of California on the left). • In 1950, scientist Otto Berg developed film from one of these tests and pieced together several photos into a mosaic of a large tropical storm over Brownsville, Texas a u g u s t 2 5 , 2 0 0 2
Early Space-based Imagery • Television and Infrared Observational Satellite (TIROS-1) launched on April 1, 1960 • The first experimental weather satellites began with TIROS-1. The main instrument was a vidicon, which is a modified television camera that scanned through 500 lines, each containing 500 pixels. Shown bottom right are the first images returned from TIROS-1. a u g u s t 2 5 , 2 0 0 2
Early Space-based Imagery • During Mercury & Apollo programs, Astronauts provided us with breathtaking & scientifically interesting pictures of our home planet • Earth's cloudy surface, as seen by Alan Shepard onboard the Mercury-Redstone 3 (MR-3) spacecraft on May 5, 1961, the first U.S. manned spaceflight • The first Earthrise seen from the surface of the moon by the first Apollo Lunar landing mission a u g u s t 2 5 , 2 0 0 2
Satellite Remote Sensing: Art & Science • “Remote sensing” coined by Evelyn Pruitt in mid-1950s • The term refers to measurement or observation of an object from a distance using an artificial device without disturbing the intervening medium • Earth Resources Technology Satellite (ERTS) launched in 1972 (later renamed Landsat-1) • Idea was born when RCA approached terrain photographers at NASA GSFC to use a Return Beam Vidicon (RBV) camera on an unmanned satellite to produce high-res imagery for geo- logical & other scientific purposes • The spectacular photography from the Apollo program largely responsible for providing the impetus to develop & launch the first Landsat satellite • Provides a continuous, consistent & high quality 30- year data set of Earth’s land surfaces and changes over time. a u g u s t 2 5 , 2 0 0 2
Atmospheric Research Satellites • The launch of Nimbus-7 in 1978 marked a milestone in providing space-based sensors for scientific research of Earth’s atmosphere on a global scale • This artist’s drawing shows the satellite’s nadir deck containing eight Earth-viewing sensors, including the first Earth Radiation Budget (ERB) experiment a u g u s t 2 5 , 2 0 0 2
Politics, Science & Ozone Depletion • Mario Molina and Sherwood Rowland • In 1973, these U. of Cal. researchers published their theory that man-made chlorofluorocarbons (CFCs) could damage the Earth's stratospheric ozone shield. • The theory was controversial, but 2 years later the U.S. Congress asked NASA to develop a "comprehensive program of research, technology, and monitoring of phenomena of the upper atmosphere.” • Ironically, the ozone "hole" over Antarctica wasn't discovered until May 1985, by J.C. Farman using a ground-based Dobson ozone spectrophotometer. He found that stratospheric ozone over Halley Bay was about 40 percent less than what had been measured during the previous winter. • NASA researchers had detected the hole too, but were slowed to press by bad surface validation data a u g u s t 2 5 , 2 0 0 2
NASA’s Earth Observing System • Toward a comprehensive, wholistic examination of our planet • Scientists increasingly recognized the 4 major spheres of the Earth’s environment all interact in many simple & complex ways. NASA’s goal is to understand how these spheres interact so that we can construct computer models of the system, enabling us to predict future changes. • As the centerpiece of its Earth Science Enterprise, NASA’s Earth Observing System began in the early 1990s, comprised of: • A new generation of satellite sensors • A robust new data system (EOSDIS) • Multi-disciplinary, multi-national teams of scientists a u g u s t 2 5 , 2 0 0 2
Chemistry of Ozone Formation & Depletion • Chlorine monoxide (left) and ozone concentration (right) derived by MLS at approximately 18 km altitude on August 27, 1997, and October 10, 1997, respectively. The high chlorine monoxide within the Antarctic polar vortex in the left-hand figure (green, yellow, and red) is directly associated with, and leads to, a reduced ozone concentration shown in the right-hand figure (purple). Chlorine reacts with ozone, forming chlorine monoxide & oxygen. Chlorine monoxide reacts with oxygen to free up the original chlorine atom to further destroy ozone, setting up a vicious cycle. a u g u s t 2 5 , 2 0 0 2
Why is Space-based Remote Sensing Useful? • Provides a long-term global perspective on climate “teleconnections” we would not otherwise have a u g u s t 2 5 , 2 0 0 2
Why is Space-based Remote Sensing Useful? • Provides the ability to zoom in on surface phenomena, such as Natural Hazards, and observe and quantify changes a u g u s t 2 5 , 2 0 0 2
Why is Space-based Remote Sensing Useful? • Space-based remote sensors allow us to observe & quantify Earth’s environments in regions of the electromagnetic spectrum to which our eyes are not sensitive a u g u s t 2 5 , 2 0 0 2
Symptoms of Change over the Last 100 Years • Human population has tripled • Humans have altered 40 percent of the Earth’s land surface • The rate of biomass burning has quadrupled—we consume an average of 175 million acres of forest & grassland annually • Levels of carbon dioxide have risen by 30 percent • We introduced chlorofluorocarbons (CFCs) into the stratosphere that destroy ozone there • Global temperatures have risen by ~ 0.5°C - 0.7°C • About 24 mm more rain will fall in 2000 than in 1900 • Today, 2-3 glaciers disappear every year—Glacier Park may be renamed “No-Glacier National Park” by 2050 a u g u s t 2 5 , 2 0 0 2
Come explore your world in NASA’s award-winning web site, at ... http://earthobservatory. nasa.gov a u g u s t 2 5 , 2 0 0 2
Internet References [1] http://orca.rsmas.miami.edu/classes/mpo551/mike/ideas.html [2] http://www.ucar.edu/communications/ucar25/forecasts.html [3] http://www.english.udel.edu/lemay/franklin/ [4] http://65.107.211.206/science/fourier.html [5] http://acd.ucar.edu/textbook/ch15/Fourier/Fourier.cite1.html [6] http://www.tyndall.ac.uk/general/john_tyndall_biography.shtml [7] http://www.tyndallpublications.com/johntynd.htm [8] http://www7.nationalacademies.org/opus/El_Nino_and_La_Nina_3.html [9] http://www.ce.berkeley.edu/~silverman/walker/walker.html [10] http://www.copernicus.org/EGS/egs_info/bjerknes.htm [11] http://ess.geology.ufl.edu/usra_esse/ENSO_History.html [12] http://www.hao.ucar.edu/public/education/sp/images/langley.html [13] http://www.clpgh.org/exhibit/neighborhoods/northside/nor_n112.html [14] http://earthobservatory.gsfc.nasa.gov/Library/Arrhenius [15] http://geography.aboutcom/library/weekly/aa121498.htm?once=true& [16] http:///www.gi.alaska.edu/ScienceForum/ASF8/825.html [17] http://scilib.ucs.edu/sio/archives/siohstry/revelle-biog.html [18] http://www.mbari.org/ghgases/revelle/text.htm [19] http://rst.gsfc.nasa.gov [20] http://earthobservatory.nasa.gov a u g u s t 2 5 , 2 0 0 2
Recommended Further Reading Parkinson, C. L., 1985: Breakthroughs: A Chronology of Great Achievements in Science and Mathematics, G. K. Hall & Company, Boston, 576 pp. Gurney, R.J., J.L. Foster and C.L. Parkinson, 1993: Atlas of Satellite Observations Related to Global Change, Cambridge University Press, Cambridge. Manuel, Diane, 1996: Encyclopedia of Weather and Climate, Oxford University Press, New York, 315 pp. Parkinson, C. L., 1997: Earth From Above: Using Color-Coded Satellite Images to Examine the Global Environment, University Science Books, Sausalito. Fleming, James Rodger, 1998: Historical Perspectives on Climate Change, Oxford University Press, Oxford, 194 pp. Lowman, Paul D.,1999: “Landsat and Apollo: The Forgotten Legacy.” Photogrammetric Engineering & Remote Sensing. Oct 99, pp 1143-47. Christianson, Gale E., 1999: Greenhouse: The 200-Year Story of Global Warming. Walker & Company, New York, 305 pp. a u g u s t 2 5 , 2 0 0 2