Download
1 / 36
360 likes | 466 Vues
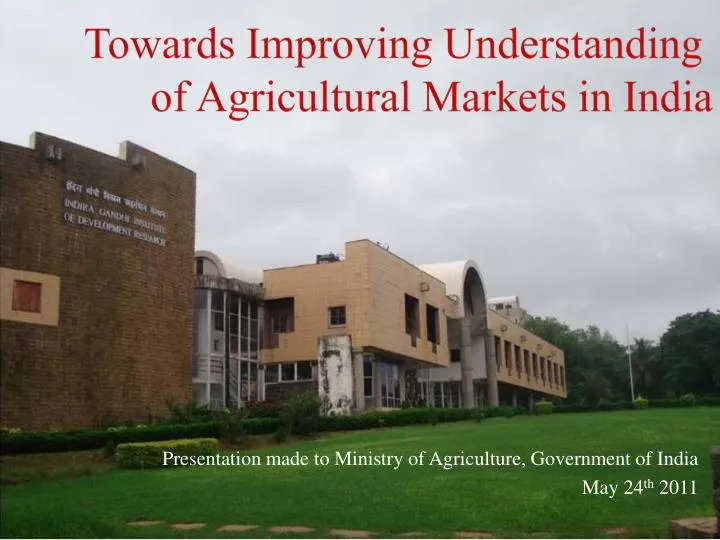
Towards Improving Understanding of Agricultural Markets in India. Presentation made to Ministry of Agriculture, Government of India May 24 th 2011. Objective.

E N D
Towards Improving Understanding of Agricultural Markets in India Presentation made to Ministry of Agriculture, Government of India May 24th 2011
Objective • Prices: Price Behaviour, Volatility Price Transmission: Farm gate →Wholesale ↔ Retail, Domestic ↔ International, Thinness of international market • Consumption: Monetization of economy, Changes in diet, calorie and nutritional content • Output: Composition of Output, Yield, Efficiency (NFSM), Ground Truthing • Data Issues and Taxonomy for Agriculture Statistics • Policy Responses to Volatility and Mitigation: Short, Medium and Long Run – Supply and Demand Side, Reliance on market mechanism, Trade policy
Characterising Price Behavior • Cyclic pattern i.e. swings from trough to peak • Right skewness: Upward spikes not matched by similar price decline • Excess kurtosis: Tails of the price distribution fatter than the normal • Time varying volatility: Unstable variance across time • Stochastic trend: Random movements across an average price • Positive autocorrelation due to storing of commodities from the harvest to post-harvest season
Characterising Price Behavior • Variation of prices over intra harvest period and distribution of prices across regions • Volatility - by type of commodity (characteristics) • Seasonal • Storage*, Warehouse Receipts • Futures Market (Why markets function well in some commodities) • Market Integration • Objective 1: Identify Cycles, Temporary / Permanent Shocks, Structural Factors - Group commodities based on their price behavior Literature
Price Transmission: Farm gate →Wholesale ↔ Retail • Imperfect price transmission: • Incomplete transmission • Lags in price adjustment between respective stages in the marketing chain • Asymmetric responses to positive and negative price changes • Market structure matters - Number of market intermediaries, Differences in volumes transacted in Mandis, Market integration
Price Transmission: Farm gate →Wholesale ↔ Retail • Asymmetry in transmission from wholesale to retail – Increase in the wholesale prices is passed on quickly (no. of days) to consumers as compared to a decrease • Size and speed of transmission is crucial from policy perspective • Frequency of price change and quantum of price change • Objective 2: Understanding transmission mechanism Literature
Price Transmission: Domestic ↔ International • Objective 3: To quantify ‘thinness’ of market and understand its implications for price transmission and trade policy • International trade in agricultural commodities by country commodity pairs. What is the duration and volume of trade by country commodity pair? • Composition of India’s (exports and imports) trade basket & role of tariffs • Studying impacts (such as trade, welfare and revenue effects) associated with alternative trade policy scenarios can be analyzed using the SMART model
Consumption • Looking at • Trends in Consumption • Producer: Monetization of the rural economy, vulnerable to price volatility • Consumer: Prices, Affordability, Dietary habits
Consumption • Inferring food security from consumption patterns (NSSO Data) Calorific content of India’s agricultural output, Food Security: Macro → Household (?) (Markets, Prices, Affordability) • Technology & fortification • Changing patterns in domestic consumption • Objective 4: Secondary data analysis using NSSO data and NNMB data to understand linkages between household occupation, poverty and nutritional value of consumption basket
Output : Composition and Yields • Trends in Production and Yields • Food grains (buffer stocks, PDS) & Non Food grains • Vegetables • Fruits • The G-20 document talks about Rice, Wheat, Maize – such a focus is very narrow • Objective 5: The debate on food-non food crop production and its impact on prices – Relevance to India (CGE model)
Improving Yields • Bridging Yield Gap - Ensure access to existing technology, gaps in access & use of technology across agro climatic regions, developing new technology (shifts the production frontier - collaborate with agricultural scientists) • Improving Yields - Investments in agriculture and Investments for agriculture • Objective 6: Use the unit level cost of cultivation (input and output) data to understand the extent to which farmers are away from the production frontier and quantify the yield gap
Investments in / for Agriculture • Objective 7: Analysis of state governments capital expenditure (1991-2010) on agriculture • Objective 8: Quality of ‘investments in’ and ‘investments for’ agriculture : Examine specific schemes – for example RIDF (NABARD) • Objective 9: Output elasticity of agricultural credit • Objective 10: Relate the yield gap to quality of investments in and investments for agriculture – subject to availability of data on yield gap • Objective 11: Review paper on role of markets & institutions
Factors contributing to increase in food production • Objective 12: Pilot Study of impact of NFSM • Role of ATMA • Convergence with other programmes • Identify a cluster of villages in one or two districts where production has increased • Conduct survey to identify factors
Validation of Crop Forecasts • Objective 13: Ground Truthing Exercise *(V.C) • Developments in remote sensing techniques have enabled generation of contemporaneous estimates of crop area and production • Identify a district covered under National Food Security Mission for ground truthing the estimates from remote sensing data • IGIDR needs to collaborate with ISRO \ National Remote Sensing Agency in this regard
Online Digital Portal • Objective 14: Online Portal • IGIDR will collaborate with IRIS Knowledge Foundation (IRIS-KF) to build the online portal on aspects related to agriculture • IRIS-KF has developed eSocialSciences, an online social science portal and Knowledge Community on Children in India for UNICEF
Taxonomy for Agricultural Statistics • Rangarajan Committee – Recommended use of XBRL. XBRL is now the mandated reporting standard for banks and companies in India • This reporting standard can be extended to socio-economics statistics including agricultural statistics • In order to work towards adoption of XBRL standard it is important to develop a taxonomy • Objective 15: Review paper on improving agricultural statistics – the role of XBRL
Deliverables • Develop a comprehensive interlinked database • Taxonomy for Agricultural Statistics • Knowledge Briefs - 4 Pager • Discussion Papers • Analytical Papers • Dissemination
Issues for Discussion • Access to price database (available online and internally within the ministries), cost of cultivation data, NNMB data • Collaboration – Identify partner institutions • Budget to be finalized upon clarity on scope and duration of the project
Recap of Objectives • Group commodities based on their price behavior • Domestic price transmission mechanism • Frequency of price change • Thinness of international market and its implications • Linkages between household occupation, poverty and nutritional value of consumption basket • Debate on food-non food crop production and its impact on prices • The extent to which farmers are away from the production frontier and quantify the yield gap • State governments capex on agriculture
Recap of Objectives • Quality of investments in and investments for agriculture • Output elasticity of credit • Relate the yield gap to quality of investments in and investments for agriculture • Review paper on role of markets & institutions • Pilot study on National Food Security Mission • Ground Truthing Exercise • Online Portal • Taxonomy for Agricultural Statistics
Trend • Deflated prices of wheat and corn show a downward trend from 1950 to 2001 (Wright, 2011) • Trends in the price series studied through the unit root analysis (Cuddington, 1992; Ghoshray, 2010) • Long run trends are small as compared to the price variability (Cashin and McDermott, 2002) • Decline in the trend is not gradual but takes place in “installments” i.e the price series have structural breaks (Zanias, 2005)
Cycles • Real commodity prices are characterised by long-cycles (Hadri, 2010) • Reasons for the cyclic pattern: Low elasticity of demand and supply, Speculative bubbles • Commodity price cycles are characterized by short-lived booms and sharp bursts (Deaton and Laroque, 1992; Deaton, 1992) • The presence of cycles create booms and busts in GDP (exports) and hence the estimates of magnitude, duration and shape of the cycle are important from the policy perspective
Cycles contd... • Cashin, McDermott and Scott (1999) date commodity prices using the Bry-Boschan business cycle algorithm and estimate the amplitude, duration and frequency of the cycle. They also examine whether the duration spent in either boom and slump affects the probability of a change in the state • Price slump lasts longer than the booms (Cashin and McDermott, 2002) • Labys et al. (2000) use the NBER (Moore, 1980) chronology to find the timing, frequency and amplitude of price cycle
Frequency of Price change • It reflects how quickly prices adjust in response to changing demand and supply conditions • Is the frequency of price change equal for both the wholesale and retail markets at a centre • How synchronized is the frequency of price change across different markets in the country
Frequency of Price Change • Frequency of price change implies the percentage of price quotes which changed values from their last month level • Disaggregated CPI data has been used to understand the frequency of price change (Bils and Klenow (2004); Baharad and Eden(2004)) • The aim is to understand whether prices change in a staggered (State Dependent Pricing) or random (Time-Dependent Pricing) manner • Hazard Functions are further used to measure the predictability of a price change
Frequency of Price Change and Hazard Function • Hazard function represents the distribution of the length of time that elapses from the beginning of an event until its end (Ikeda and Nishioka, 2007) • Hazard rate, an outcome of the hazard function predicts the chances of prices changing in the next period given that they have remained constant till the last period.