Download
1 / 25
250 likes | 505 Vues
Contaminant Levels in Alaskan Populations and Marine Mammals. Talking Points. Which chemicals should we consider for RSC or at all? See white paper distributed by Brock Which chemicals are relevant to Alaska? E.g. In the U.S. all uses of toxaphene were banned in 1990

E N D
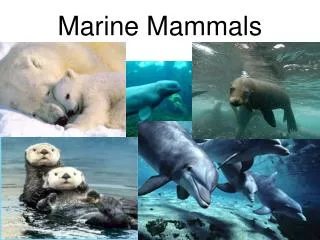
Contaminant Levels in Alaskan Populations and Marine Mammals
Talking Points • Which chemicals should we consider for RSC or at all? • See white paper distributed by Brock • Which chemicals are relevant to Alaska? • E.g. In the U.S. all uses of toxaphene were banned in 1990 • Which ones do not have an RfD • E.g. p-DDE has an oral cancer slope factor but no RfD • PCBs have a CSF but only some Aroclor mixtures have an RfD • Contaminants’ levels can be elevated in MM tissues • What species/tissues are the most consumed? • Alaska populations consuming marine mammals can show elevated body burdens of contaminants • They may be exposed to levels considered “unsafe” • How does the concept of RSC apply to these populations?
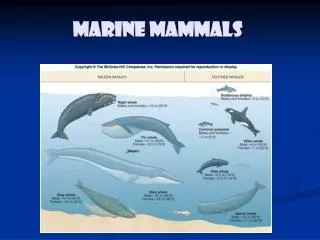
Contaminants in MM tissues • HCB • HCH • PFCs • PBDEs • PCBs • DDTs • (PAHs in clams?) • Levels are variable depending on • Location/habitat • Species • Age, sex, tissue type • Many contaminant have been measured in MM tissues: • Cadmium • Mercury • Cis-Chlordane • Oxy-chlordane • Heptachlor • Heptachlor epoxide
Concentrations Variations with Animals’ Sex Male to Female Ratio for some Contaminants Concentrations in Beluga Whale Tissues Generally, males seem to accumulate higher contaminant levels Limitation: No age information Hoguet et al. 2013, Krahn et al. 1999
Concentrations Variations with Animals’ Age Mercury in Harbor Seal Liver and Heart
Concentrations Variations with Tissue Type Mercury in Harbor Seal liver and heart Seals were from Kodiak and Prince William Sounds Heart Liver 2 orders of magnitude N=80 N=38 N=17 Marino et al. 2011
PCB Residues in DomesticRaw Foods for Fiscal Years 1969–1976 ATSDR. 2000. PCB Toxicological Profile
Concentrations Variations with Tissue Type Median PCB Levels in Bowhead Whale Tissues (n=5) FDA’s Tolerance Level in Fish = 2 ppm (0.2-3.0 ppm PCBs for all other foods) Fish from previous slide ~ 900 ppb Shellfish from previous slide Hoekstrsa et al. 2005, O'Hara 2005
Concentrations Variations with Species Median PCB Levels in MM from Various Locations FDA’s Tolerance Level in Fish N=10,10, 11, 8, 20 N= 7 N= 6, 14, 10 N=14, 12, 25 N= 5, 3, 20 Krahn et al. 1999, Hoekstra et al. 2003, o'Hara et al. 1999, Seagars et al. 2000, Struntz t al. 2000, Kuckllick et al. 2002
Exposure of Arctic Populations • Arctic populations generally show higher levels of persistent contaminants than people from lower latitudes • Contribution of their subsistence diet • Levels vary with age, sex, location
Subsistence in Alaska From Alaska Department of Fish and game, Division of Subsistence. 2014. Subsistence in Alaska: A Year 2012 Update
Mean Pesticide Levels by Age in 5 Aleutian and Pribilof Villages, AK 1999 Comparison with NHANES (‘99-’00) • Most pesticides were not detected in NHANES subjects • Sample size ~ 600-700 for each age category NHANES 1999-2000, Geo Mean (ppb)
Blood Mercury in Alaska Native women* vs. NHANES III *Berner 2005 Today about 0.7ppb n = 205 n = 1928
Hair Mercury Levels Subsistence v non-subsistence diet • Mean hair mercury level in subsistence food users is 7.6-fold the level of their non-subsistence counterpart • 1.45 ppm (Range:0.32-4.00 ppm) v 0.19 ppm (Range: 0.03 to 0.43 ppm) Rothschild, 2002
Infant Exposure Through Breastmilk • Infants can be a significantly exposed to POPs through breast milk BDE-47 (A) and PCB-153 (B) levels in breast milk collected 6–24 weeks after birth. Hooper et al. 2007
Health Risks Associated with a Consumption of 6 oz/d? Median PCB Levels Cancer risk of 10-2 FDA’s Tolerance Level in Fish • For a 6 oz daily consumption (70 kg adult) • Cancer risk < 10-4 for a tissue concentration < 20 ppb ww • The MRL will be exceeded for a concentration > 8 ppb (Assuming 100% Aroclor 1254)
Acceptable Mercury Dose Harbor Seal Liver Safe consumption 3.5 g/d 106 g/month 3.7 oz/month ~ 4 oz/month is likely exceeded • Acceptable Hg intake: 0.4 μg/kg BW/d • For a 70 kg adult 28 μg/d • Median [Hg] in PWS Liver: 8 μg/g
Conclusion / Questions • In marine mammals, contaminant concentrations • Can be elevated • Vary widely with species, age and especially tissue type • The concept of trophic level is insufficient to characterize accumulation in MM • How to reconciliate this with the concept of RSC? • How to deal with the large variability observed within species? • Because of their subsistence life style, Arctic populations tend to be more exposed to contaminants than the general population • They might be regularly exposed to some chemicals at levels exceeding what is considered safe • How does the RSC apply?