Download
1 / 61
610 likes | 620 Vues
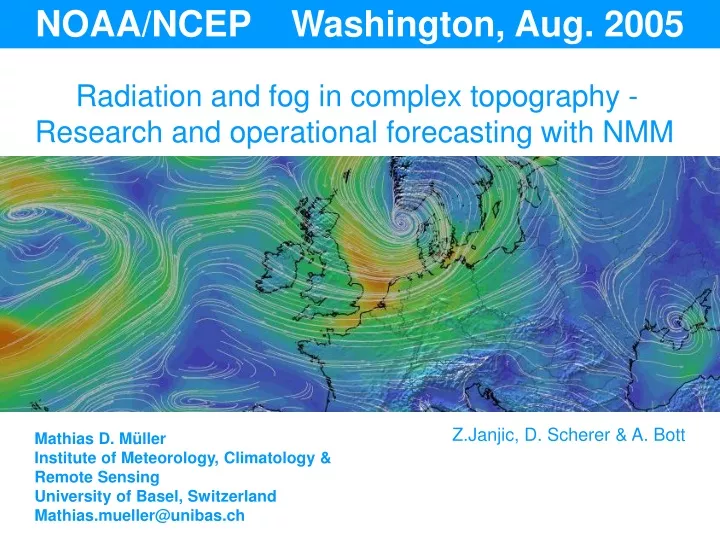
NOAA/NCEP Washington, Aug. 2005. Radiation and fog in complex topography - Research and operational forecasting with NMM. Z.Janjic, D. Scherer & A. Bott. Mathias D. Müller Institute of Meteorology, Climatology & Remote Sensing University of Basel, Switzerland Mathias.mueller@unibas.ch.

E N D
NOAA/NCEP Washington, Aug. 2005 Radiation and fog in complex topography - Research and operational forecasting with NMM Z.Janjic, D. Scherer & A. Bott Mathias D. Müller Institute of Meteorology, Climatology & Remote Sensing University of Basel, Switzerland Mathias.mueller@unibas.ch
WHAZZZUPP ! The forecast system at the University of Basel A radiation parameterization of topographic effects Towards a 3D fog model Coffee and Cookies :-)
Realtime Forecasts / Nesting GFS 00/12 UTC NMM-22 & ETA-22 00/12 UTC 5 grids 72 h NMM-4 03/15 UTC ETA-4 15 UTC NMM-2 15 UTC 45 h
Hardware Weather Forecast & Post Processing Beowulf Cluster Theoretical Performance 386 Gflops1 Master 2 x 2.4 GHz Xeon Cpu's, 2GB Mem1 Fileserver 1.1TB Disk36 Nodes 2 x 2.4 GHz Xeon Cpu's, 2GB MemGigabit Ethernet and SCI interconnect Visualisation & Preprocessing 2 x 3.0 GHz Xeon CPU‘s, 4 GB Mem, Linux OS IDL, 2 TB Disk
NWP at the University of Basel - Flow chart NOAA/NCEP 3D-VAR / GFS Sea-temperatue Snow RS - Bern NDVI Snowmask Meteoblue MeteoSwiss Observations Meteomedia Observations Visualisation Current forecast Archive short-term Archive Initalization phase 1 Verification Kalman Cronos File-Server / Cluster tasks management Forecast Model on Cronos Cluster Final Initialization Post processing 3D-VAR not implemented! EXTERNAL URZ WS-ETA Synchronized communication (MPI) Co VAR Data
NDVI initialization with NOAA-AVHRR CLIMATOLOGY AND REALTIME NDVI CLIMATOLOGY NDVI REALTIME NDVI AUGUST, 13 2003 AGGREGATED TO 4 KM MODEL RESOLUTION
22 km NMM 4 km NMM Operational Model Statistics Forecast output of 5 Model Grids: 35 GB / 24h Total number of Images produced: ~ 20‘000 / 24h Programming language for all Graphics: IDL Operating System: LINUX Communication and time synchronisation with forecast Models, running on Cronos Cluster. Computing Time: NMM22 ~ 60 min (critical !) NMM4 ~ 90 min NMM2 ~ 4 hours 2km NMM Computing Time of Models is upper limit for Visualisation time
Forecast Visualisation – key points Efficiency of Visualisation Data and Information Reduction / Aggregation (storage and resolution restrictions) (e.g. Smoothing, Skipping, 24h-precipitation) Conversion / Computation of Variables for visualisation from raw model output (e.g. Vorticity, CAPE, Helicity, Streamlines) Precomputation of domain dependent but constant layers (Topographic Shading, Continent outlines,….) Model Coordinate Systems (Lambert, Eta-Grid, …, Lat/Lon) Internal Coordinate System (Geographical Lat/Lon) Projection / Mapping to different Coordinate Systems for Visualisation Scaling: constant, image optimized, constant-optimized for forecast range
Pictograms – it‘s for children 3. Web-page compilation: 1. Local field statistics: 2. Decision Tree: no rain rain Rain Cloud Cover Temperature ….. Rain Cloud Cover Temperature ….. clouds Rain Cloud Cover Temperature ….. Rain Cloud Cover Temperature …..
A radiation parameterization of topographic effects Mathias Müller, Dieter Scherer
Parameterization features Radiation fluxes from Mesoscale Model Land-Surface Model of Mesoscale Model Considers: Slope and azimuth angle of absorbing surface Shadows Sky-view restriction Negligible computational costs Computation of radiative mean fluxes for model grid cells based on higher resolution DEM Interface between land-surface model and radiative transfer model Relatively easy to include in other models (sandwich-like) Parameterization features
Shortwave radiation - direct & diffuse Radiation fluxes from Mesoscale Model Land-Surface Model of Mesoscale Model
Longwave radiation Radiation fluxes from Mesoscale Model Land-Surface Model of Mesoscale Model
Effects of slope angle, slope aspect and shadow • affects: • direct shortwave
Effects of slope angle, slope aspect and shadow • affects: • direct shortwave
Effects of slope angle, slope aspect and shadow • affects: • direct shortwave
Effects of slope angle, slope aspect and shadow • affects: • direct shortwave
Sky-view factor 0.5 • affects: • diffuse shortwave • longwave
Case Studies Parameterization was tested in the Nonhydrostatic Mesoscale Model (NMM) of NOAA/NCEP (version: Z. Janjic) 220 Alpine stations
2m Temperature Differences +2 K Sun facing -3 K shadow
2m Temperature Differences 0.5 +2 K in Valleys • Skyview affects: • diffuse shortwave • longwave
Verification – Clear sky summer conditions (alpine stations) 22 June 2003 Nighttime warming reduces model cold bias (0.5K) Problem of verification: Stations are located in valleys but radiation affects slopes
Verification – overcast conditions (alpine stations) 24 December 2003 Nighttime warming reduces model cold bias
Benefits from subgrid topography doubles the effect ! 4 km Grid with 1 km subgrid topography
Conclusions Radiation fluxes from Mesoscale Model Land-Surface Model of Mesoscale Model Mean radiation flux based on high resolution DEM Modifies temperature in a full physics NMM run up to +/-3 K Reduces nighttime cold bias by about 0.5-1 K No computational costs during time integration Easy to implement, sandwich-like module for mesoscale models
3D fog with NMM and PAFOG Mathias Müller, Andreas Bott, Zavisa Janjic
NMM_PAFOG Droplet number concentration Liquid water content NMM dynamical framework PAFOG microphysics Condensation/evaporation in the lowest 1500 m is replaced by PAFOG
PAFOG microphysics Supersat. where S is the Supersaturation Assumption on the droplet size distribution : Log-normal function D droplet Diameter Dc,0 mean value of D σc Standart deviation of the given droplet size distribution (σc=0.2)
GRID of NMM_PAFOG 50 x 50 x 45 27 layers in the lowest 1000 m 11 soil layers Thickness(cm): 0.5 0.75 1.2 1.8 2.7 4.0 6.0 10 30 60 100
Boundary conditions for dNc HEIGHT PAFOG TOP 1000 m σc 1000m PAFOG TOP
Nesting GFS NMM-22 NMM_PAFOG GRID: 50 x 50 x 45 (+11 soil layers) dx: 1 km dt: 2s (dynamics) / 10s (physics) CPU: 40 min/24hr on 9 Pentium-4 (very efficient!) NMM_PAFOG NMM-4 NMM-2 15 UTC
19:00 MEZ (3 hr forecast) PAFOG STANDARD 27 Nov 2004
22:00 MEZ (6 hr forecast) PAFOG STANDARD 27 Nov 2004
02:00 MEZ (10 hr forecast) PAFOG STANDARD Accurate sedimentation in PAFOG due to dNc computation. 28 Nov 2004
08:00 MEZ (16 hr forecast) PAFOG STANDARD 28 Nov 2004
10:00 MEZ (18 hr forecast) PAFOG STANDARD 28 Nov 2004
qc at 5m height (01:00 MEZ) PAFOG STANDARD
qc at 5m height (06:00 MEZ) PAFOG STANDARD
Cold air pooling (05:00 MEZ) too cold !
Cold bias problem Z.Janjic
19:00 MEZ (3 hr forecast) PAFOG STANDARD 27 Nov 2004
22:00 MEZ (6 hr forecast) PAFOG STANDARD 27 Nov 2004
02:00 MEZ (10 hr forecast) PAFOG STANDARD Accurate sedimentation in PAFOG due to dNc computation. 28 Nov 2004