Download
1 / 21
210 likes | 220 Vues
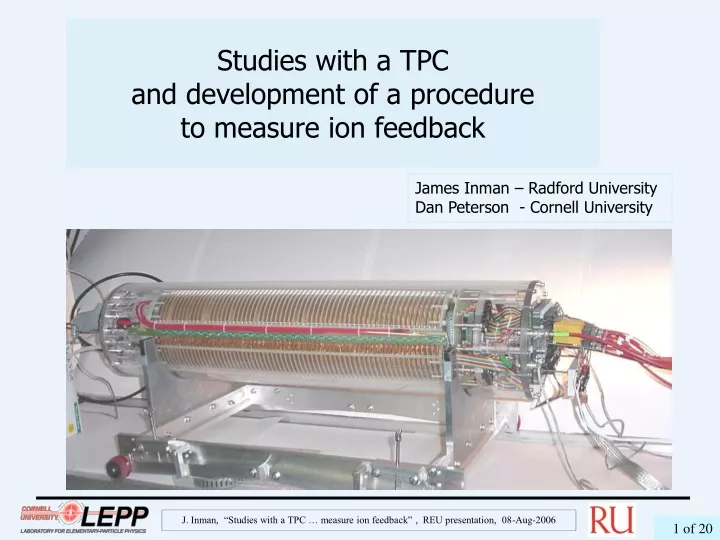
Studies with a TPC and development of a procedure to measure ion feedback. James Inman – Radford University Dan Peterson - Cornell University. Equipment, Amplifiers and Electronics. High voltage system: -20 kV module, 2 channels -2 kV module, 4 channels. Readout:

E N D
Studies with a TPC and development of a procedure to measure ion feedback James Inman – Radford University Dan Peterson - Cornell University J. Inman, “Studies with a TPC … measure ion feedback” , REU presentation, 08-Aug-2006
Equipment, Amplifiers and Electronics High voltage system: -20 kV module, 2 channels -2 kV module, 4 channels Readout: VME crate Struck FADC Wires (Multi-Wire-Proportional-Chamber) Micromegas GEM J. Inman, “Studies with a TPC … measure ion feedback” , REU presentation, 08-Aug-2006
Sample data taken with Cornell TPC ArCO2 (10%) , 300V/cm Gas gain: ~ 300 tracks Micromegas event – raw (no smoothing) 25 MHz , 40 ns 2048 time buckets (81.92 ms) J. Inman, “Studies with a TPC … measure ion feedback” , REU presentation, 08-Aug-2006
Implementing Program in Visual C++ track • Design Goals: • Maintain functionality of old program • Allow for analysis of ion feedback • Interactive control • Optimize run speed J. Inman, “Studies with a TPC … measure ion feedback” , REU presentation, 08-Aug-2006
TPC Data Analysis Program – Block Diagram Initialize event class Form1 - GUI Load channel pad configuration data file Load analysis configuration data file Get TPC data file name Open data-file-list file, load list of TPC data file names or Create ROOT File? Initialize ROOT components Create ROOT file Open TPC data file Pulses & Event Load event from TPC data file Analyze event Tracks Fill ROOT tree Ion Feedback Plot event J. Inman, “Studies with a TPC … measure ion feedback” , REU presentation, 08-Aug-2006
TPC Data Analysis Program - Data Files N MAP! • Channel Pad Configuration • Contains information about the layout of the TPC (# rows, #pads, …) • Maps the channels of data in the TPC data files to the pad board layout (channel# -> (row, pad)) • Contains the geometry of the padboard, used for track fitting and plotting • Analyze Configuration • Has 3 sets of 35 input parameters that are used to analyze data • Data smoothing (smoothwidth) • Pulse identity (thresh, recoverwidth) • Track fitting (pad pulse sharing) J. Inman, “Studies with a TPC … measure ion feedback” , REU presentation, 08-Aug-2006
TPC Data Analysis Program - ROOT • Create an ntuple tree • A tree stores data • TTree object consists of branches that can hold any type of data from integers to classes • Branches are filled for each event • Create ROOT file • Contains ROOT objects (in particular my TTree) • ROOT is run in “interactive” mode (root.exe) and file is opened to make cuts on the data and then plot histograms J. Inman, “Studies with a TPC … measure ion feedback” , REU presentation, 08-Aug-2006
Ion Feedback Measurement Positive ions are created in the amplification and drift back into the field cage. Ion feedback is expected to be suppressed with the GEM or Micromegas devices relative to MWPC. We measured ion feedback on the field cage termination plane, for individual tracks. This is a different method than used by other groups and will allow a more direct comparative measurement of ion feedback in the various devices. J. Inman, “Studies with a TPC … measure ion feedback” , REU presentation, 08-Aug-2006
Ion Feedback Measurement Wire Amplifier Wire amplifier produces large feedback signal this is why it is unsuitable for use in the ILC It is used as a starting point for measuring ion feedback Field cage termination plane Located between field cage and amplifier (next slide) J. Inman, “Studies with a TPC … measure ion feedback” , REU presentation, 08-Aug-2006
Field Cage Termination Single Field Cage Termination Double Field Cage Termination The field cage termination provides a close to uniform potential plane while still being transparent It would not collect ion signal; ions drift past the plane into the field cage Allows for an area to be defined with a reverse electric field This reduces transmission of elections from track and allows for ions drifting back into the field cage to be collected on wires J. Inman, “Studies with a TPC … measure ion feedback” , REU presentation, 08-Aug-2006
Partial Transmission Mode Transmission coefficient of electrons through double field cage termination wires using Micromegas ~40% transmission at bias voltage of -450 V ~60% of the ion feedback should be detected by the field cage termination wires Single Grid (maximum transmission) -300 V/cm +300 V/cm 0 V/cm Bias Voltage (-V) J. Inman, “Studies with a TPC … measure ion feedback” , REU presentation, 08-Aug-2006
40% Transmission Mode, 5mm Drift X-axis is in units of data buckets Top 6 traces are from pad board, data collected at 20ns/bucket (82 µs) Bottom traces are from FCT, data collected at 320ns/bucket (655 µs) Logic pulses identify pulse threshold crossings Pulse observed on field cage termination, is this ion feedback? J. Inman, “Studies with a TPC … measure ion feedback” , REU presentation, 08-Aug-2006
40% Transmission Mode, 5mm Drift Average pulse delay time is 202 µs with σ = 8.7 µs Average relative pulse height is 6.0% Initial Results calculated by hand, not fun J. Inman, “Studies with a TPC … measure ion feedback” , REU presentation, 08-Aug-2006
“Full” Transmission Mode, 5mm Drift Pulse still observed on field cage termination By observation pulse looks smaller J. Inman, “Studies with a TPC … measure ion feedback” , REU presentation, 08-Aug-2006
“Full” Transmission Mode, 5mm Drift Average pulse delay time is 207 µs with σ = 9.3 µs Average relative pulse height is 4.2% J. Inman, “Studies with a TPC … measure ion feedback” , REU presentation, 08-Aug-2006
“>Full” Transmission Mode, 5mm Drift Pulse still observed on field cage termination; decreased signal to noise ratio makes pattern-recognition difficult J. Inman, “Studies with a TPC … measure ion feedback” , REU presentation, 08-Aug-2006
“>Full” Transmission Mode, 5mm Drift Average delay time is 216 µs with σ = 21 µs Average relative pulse height is 2.6% (reduced by 43%) Pulse Height is effectively controlled by bias voltage applied to field cage termination J. Inman, “Studies with a TPC … measure ion feedback” , REU presentation, 08-Aug-2006
40% Transmission Mode, 7mm Drift Change the ion drift distance to see if the pulse changes accordingly Pulse observed on field cage termination with a noticeably later time J. Inman, “Studies with a TPC … measure ion feedback” , REU presentation, 08-Aug-2006
40% Transmission Mode, 7mm Drift Average pulse delay time is 245 µs with σ = 7.9 µs (5mm – 202 µs) Pulse delay time increase of 21% (40% drift distance increase) Average relative pulse height is 7.4% (5mm – 6.0%) J. Inman, “Studies with a TPC … measure ion feedback” , REU presentation, 08-Aug-2006
Results / Next Created a new display and analysis program in Microsoft C++ that can be used to analyze ion feedback Ion feedback was measured from a wire amplifier which has a large gain (x300) An attempt to measure ion feedback from the double layer GEM amplifier was made; however, the GEM has an expected gain that is 10% of the wire amplifier and only 5% of the ion feedback Plan to make a pulsing voltage bias on the field cage termination to allow full transmission of electrons and then pulse field to collect ions, need pulsing circuit and electronic amplifiers that can withstand pulsing bias Smaller diameter wires on the field cage termination would increase field near wire increasing feedback signal (20 µm -> 8 µm) A triple layer GEM would provide much more signal amplification Make more measurements of ion feedback ; measure ion feedback for various amplifier devices. J. Inman, “Studies with a TPC … measure ion feedback” , REU presentation, 08-Aug-2006
Acknowledgements I would like to thank Dan Peterson of Cornell University for being my mentor and guiding me through my research expeirence. Thanks to Tarek Anous for his encouragement, programming assistance, and daily entertainment. Thanks to Chris Macklin for getting me started with ROOT and to LEPP Computing. Thanks to all the other REU students for adding plenty of excitement and support. And much thanks to Rich Galik for his dedication to the REU program and genuine interest in the success of all the REU students. J. Inman, “Studies with a TPC … measure ion feedback” , REU presentation, 08-Aug-2006