Download
1 / 14
221 likes | 2.22k Vues
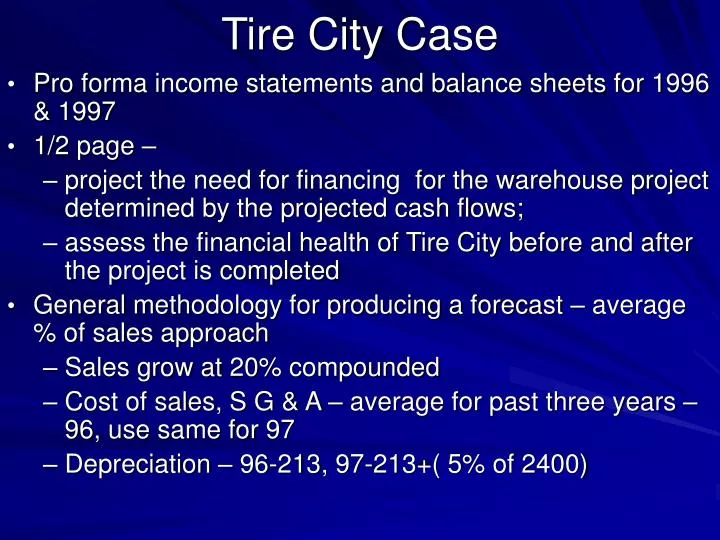
Tire City Case. Pro forma income statements and balance sheets for 1996 & 1997 1/2 page – project the need for financing for the warehouse project determined by the projected cash flows; assess the financial health of Tire City before and after the project is completed

E N D
Tire City Case • Pro forma income statements and balance sheets for 1996 & 1997 • 1/2 page – • project the need for financing for the warehouse project determined by the projected cash flows; • assess the financial health of Tire City before and after the project is completed • General methodology for producing a forecast – average % of sales approach • Sales grow at 20% compounded • Cost of sales, S G & A – average for past three years – 96, use same for 97 • Depreciation – 96-213, 97-213+( 5% of 2400)
Net interest expense – 96-129, 97-116 • Income tax – 45% • Dividends – 20% of PAT • Cash – 3% of sales • A/R – 15% of sales • Inventories – 96-given, 97-3148 • Gross plant and equipment – 96-given, 97-given • Accumulated depreciation – from income statement • Current liabilities – constant • A/P – 6% of sales • Bank debt - plug figure to balance • Accrued expenses – 7% of sales • Long term debt – decline by 125 • Common stock – constant • Retained earnings – beg RE +PAT-dividends
Ratios – 95, 96, 97 • Profitability • Return on assets • Gross margin • Return on equity • Liquidity • Current ratio • Quick ratio • Leverage • Debt to assets • Debt to equity • Times interest earned • Activity • Sales/assets • Days receivable • Days inventory • Days payable
Financial Statements - Forecast • Systematic projection – expected actions of management – budgets, schedules, financial statements • Working plan – statistics, ratios, relationships, funds flows, conditions, decisions, activities • Coordinated thinking – future • Reduces emergency decisions, surprises • Sets standards of performance – measure, control • Anticipate upcoming financial needs • Pro Forma statements - future
Pro forma operating statement • Sales • Trend – growth in sales • % increase in number of stores • Inflation rate • Sales per square foot • Sales per employee • Assumptions – estimates – best guess • Historical relationships • Management forecasts • Industry data • Common sense • COGS – percentage of sales • Other items – less challenge – past ratio
Financial Statements - Forecast • Income statement – project other items • Classify cost behavior – assumptions – vary with sales? • Depreciation – new assets • Interest – new debt • Taxes – rates change • Percentage of sales • Test assumptions – constant with sales? • Special cases • Interest - % of total financial liabilities • Adding new L/T assets – cost per store? • Tax rate – projected EBT • Classification of debt – current vs. L/T
Read Note on Financial Forecasting; • Read Financial Forecasting Problems; • Assign #10 - Tire City Case (due 3/10, 3/11) • Extra credit – cash flows from operations – '96 and '97.