Download
1 / 43
430 likes | 789 Vues
Explore logistic regression, its role in classification, decision boundaries, the sigmoid function, and optimizing through gradient descent for better accuracy and efficiency. Learn key concepts and techniques to apply logistic regression effectively.

E N D
Neural network and learning machines Logistic Regression Model Lec 4 Instructor: Dr. Emad Nabil
Linear regression Logistic regression Multivariate regression Polynomial regression
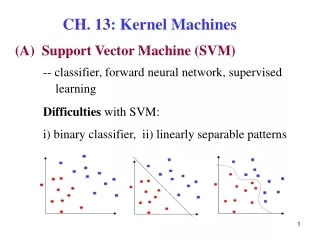
Note: Logistic regression is used for classification not for regression (prediction) like linear/polynomial regression.
https://www.slideshare.net/AdilAslam4/bayesian-classification-in-data-mining-73034171https://www.slideshare.net/AdilAslam4/bayesian-classification-in-data-mining-73034171
Classification applications Email: Spam / Not Spam? OnlineTransactions: Fraudulent (Yes / No)? Tumor: Malignant / Benign ? 0: “Negative Class” (e.g., benign tumor) 1: “Positive Class” (e.g., malignant tumor) n features m examples Training dataset
Classification using Regression The most basic step would be to try and fit regression curve to see if one can achieve classification using the same approach. (Yes) 1 Apply linear regression Malignant ? For a certain instance x calc hϴ(x) (No) 0 Tumor Size Tumor Size If hϴ(x) >= .05 X is malignant X is benign
Classification using Regression say an outlier is present like the blue data point then the same decision will be shifted to the right. problem1: a misclassification of two data points misclassification (Yes) 1 Malignant ? Apply linear regression (No) 0 Tumor Size Tumor Size For a certain instance x calc hϴ(x) If hϴ(x) >= .05 X is malignant X is benign
Classification using Regression say an outlier is present like the blue data point then the same decision will be shifted to the right. problem1: a misclassification of two data points problem2: according to the problem definition 0<=hϴ(x) <=1, to be able to assign a label, but in this case: hϴ(x) >1 misclassification (Yes) 1 hϴ(x) >1 Malignant ? (No) 0 Tumor Size Tumor Size
Conclusion about Classification using Regression Applying linear regression to classification problem might work in some cases but is not advisable as it would not scale with complexity. And we need a model where: Solution logistic regression
sigmoid function or logistic function. Plot of the sigmoid function is given below which shows no matter what the value of z, the function returns a value between 0 and 1
logistic regression • f is to be true, • there is a need of squashing function i.e. a function which limits the output of hypothesis between given range. • For logistic regression sigmoid function is used as the squashing function. • The hypothesis for logistic regression is give by,
logistic regression The value of hypothesis is interpreted as the probability that the input x belongs to class y=1. i.e. probability that y=1, given x, parametrized by θ.
Decision Boundary for the given hypothesis of logistic regression, say δ=0.5 is chosen as the threshold for the binary classification. y This is the decision boundary
Linear Decision Boundary y In this example 12
Non linear Decision Boundary It is possible to achieve non-linear decision boundaries by using the higher order polynomial terms and can be incorporated in a way similar to how multivariate linear regression handles polynomial regression.
Non linear Decision Boundary y Say, the hypothesis of the logistic regression has higher order polynomial terms, and is given by, let optimal θ given below would form an optimal decision boundary -1 0 0 1 1] Substituting Decision boundary is
As the order of features is increased more and more complex decision boundaries can be achieved by logistic regression. Be aware of overfitting !! Gradient Descent is used to search for the best parameter values of θ that make the decision boundary
The same cost function of multivariate regression would not work well for the logistic regression because the hypothesis for logistic regression is the complex sigmoid function below, givesnon-convex curve with many local minima as shown in the plot below. So gradient descent will not work properly for such a case and therefore it would be very difficult to minimize this function. Const function is NOT convex We will use another cost function which is convex
Logistic regression cost function It is clear that new cost function can be minimized because its convex.
Logistic regression cost function This cost function is reached at using the principle of maximum likelihood expectation. Below Y is the actual value
Logistic regression cost function Since y∈{0,1}, is equivalent to Now the total error will be:
Logistic regression cost function So now to get optimal θ, we need to } Now we need to compute
Gradient Descent for logistic Regression Want : (simultaneously update all ) Repeat Repeat (simultaneously update all ) Algorithm looks identical to linear regression!
Gradient Descent for logistic Regression Note: Feature Scaling is as important for logistic regression as it is for linear regression as it helps the process of gradient descent.
Multiclass logistic regression Multiclass logistic regression is a extension of the binary classification making use of the one-vs-all or one-vs-rest classification strategy.
Multiclass logistic regression Email foldering/tagging: Work, Friends, Family, Hobby y=1 y=2 y=3 y=4 Medical diagrams: Not ill, Cold, Flu y=1 y=2 y=3 Weather: Sunny, Cloudy, Rain, Snow y=1 y=2 y=3 y=4
Multiclass logistic regression Multi-class classification: Binary classification: +ve samples y= (1) x2 x2 x1 -ve samples y=(0) x1
Multiclass logistic regression We have three classes
Multiclass logistic regression cn +ve samples y= (1) -ve samples y=(0) -ve samples y=(0) -ve samples y=(0) +ve samples y= (1) +ve samples y= (1) • Each classifier hiθ(x) returns the probability that an observation belongs to class i. • all we have to do in order to predict the class of an observation is to select the class of whichever classifier returns the highest probability.
Multiclass logistic regression 28x28 784 mnist dataset 10 classifiers: to