Download
1 / 58
590 likes | 824 Vues
LabVIEW in 3 Hours. Engineering – Industries. Manufacturing. Telecom. Electronics. Automotive. Test Industries. Semiconductor. Chemical Processing. Aerospace. Transportation. Military. Biomedical. Instrumentation. Instrumentation. Data Acquisition. Virtual Instrumentation.

E N D
Engineering – Industries Manufacturing Telecom Electronics Automotive Test Industries Semiconductor Chemical Processing Aerospace Transportation Military Biomedical
Virtual Instrumentation Application Software Hardware and Driver Software Network
PXI/CompactPCI PLCs Vision Distributed I/O Data Acquisition and Signal Conditioning GPIB/Serial and VXI Modular Instrumentation Virtual Instrumentation Architecture LabVIEW Instrument / Data Acquisition Drivers
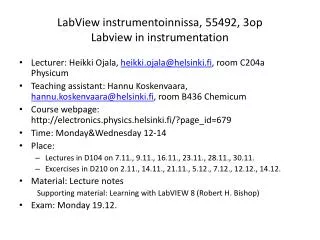
Section I – The LabVIEW Environment • LabVIEW terms • Components of a LabVIEW application • LabVIEW programming tools • Creating an application in LabVIEW
LabVIEW Programs Are Called Virtual Instruments (VIs) Two Work Areas: 1. Front Panel Controls = Inputs to the computer
LabVIEW Programs Are Called Virtual Instruments (VIs) Two Work Areas: 1. Front Panel Controls = Inputs to the computer Indicators = Outputs from the computer
LabVIEW Programs Are Called Virtual Instruments (VIs) Two Work Areas: 1. Front Panel Controls = Inputs to the computer Indicators = Outputs from the computer 2. Block Diagram Instruction set for controls, indicators “Source Code”
VI Front Panel PanelToolbar Pull-down menu Boolean Control Double Indicator Waveform Graph (Type of Indicator)
VI Block Diagram Pull-down menu Temperature Indicator Data Acquisition Function Thermometer Terminal Delay WhileLoop Stop Loop Terminal Stop Button Terminal
Controls Palette (Front Panel Window) Functions Palette (Block Diagram Window) Controls and Functions Palettes Graphical, floating palettes Used to place controls & indicators on the front panel, or to build the block diagram
Tools Palette (Front Panel) • Operating Tool • Positioning/Resizing Tool • Labeling Tool • Coloring Tool
Tools Palette (Block Diagram) Automatic Selection • Operating Tool • Positioning/Resizing Tool • Labeling Tool • Coloring Tool Wiring Tool Breakpoint Tool Probe Tool
Status Toolbar Run Button Continuous Run Button Abort Execution Pause/Continue Button Text Settings Align Objects Distribute Objects Reorder Additional Buttons on the Diagram Toolbar Execution Highlighting Button Step Into Button Step Over Button Step Out Button
Status Toolbar Run Button Continuous Run Button Abort Execution Pause/Continue Button Text Settings Align Objects Distribute Objects Reorder Additional Buttons on the Diagram Toolbar Execution Highlighting Button Step Into Button Step Over Button Step Out Button
Open a Virtual Instrument Basic Spectral Measurement.vi
Creating a VI – Front Panel Front Panel Window
Creating a VI – Front Panel Front Panel Window
Creating a VI – Block Diagram Block Diagram Front Panel Window
Creating a VI – Wiring Wire attachment points (nodes) flash when the wiring tool is passed over wiring tool Right Click Node Terminals (communication ports)
Express Functions Same overall functionality
Section II • What is a subVI? • Creating a subVI • Using a VI as a subVI
SubVIs LabVIEW is modular • Any VI can be used as a subroutine (or subVI) to other programs • Advantages • Modular • Easier to debug • Don’t have to recreate code
Creating a SubVI • Create code • Select code for use in subVI • Click Edit-Create subVI
Insert the SubVI into a Top Level VI Accessing user-made subVIs Functions >> Select a VI Or Drag icon onto target diagram
Section III – Data Acquisition • Data acquisition (DAQ) basics • Connecting Signals • Simple DAQ application
DAQ – Data Acquisition • Plug-in board for a computer with: • Analog input channels • Analog output channels • Counters • Digital I/O • Controlled by a suite of LabVIEW VIs Functions>>Data Acquisition
Hardware Connections SC-2075 BNC-2120 SCB-68
Channel Connections Signal Motor Single-Ended Measurement Ground Battery + Signal 1 Differential Measurement - Signal 2
Analog Signals Data Acquisition System 1.659487387 volts ADC 1010100111110
Channel Connections Channel Connections • Single-Ended Mode: ACHx and AIGND used to connect signal to channel x • Differential Mode: ACHx, ACHx+8 used to connect signal to channel x
Section IV – Loops and Charts • For Loop • While Loop • Charts • Graphs
Loops • While Loops • Terminated by condition • Always Runs Once • Delay between iterations may be added • For Loops • Terminate after N iterations • N specified on block diagram