Download

1 / 42
420 likes | 611 Vues
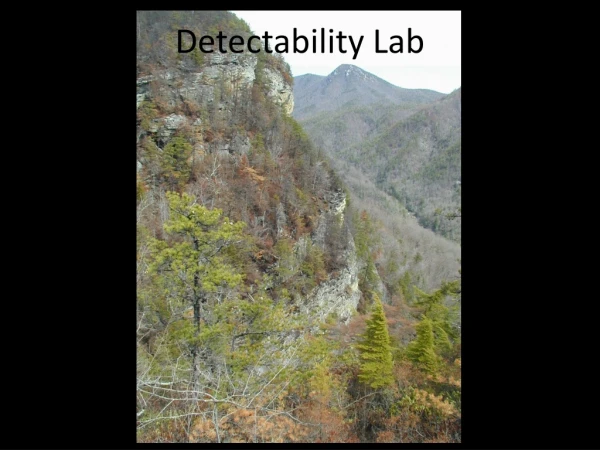
Detectability Lab. Outline. Brief Discussion of Modeling, Sampling, and Inference Review and Discussion of Detection Probability and Point Count Methods Examples with Data and Software Discussion of Upcoming Lab . Biological Modeling and Inference.

E N D
Outline • Brief Discussion of Modeling, Sampling, and Inference • Review and Discussion of Detection Probability and Point Count Methods • Examples with Data and Software • Discussion of Upcoming Lab
Biological Modeling and Inference • We want to understand the world in meaningful and often predictive ways. • Models – representations of reality • Often we seek the most parsimonious model. Conceptual Verbal Mathematical Statistical Physical Mechanical
Biological Modeling and Inference • Models should be made with clear goals in mind. • In order to make inference, models should be confronted with data. • Inference – decisions • test hypotheses • model selection • model evaluation
Sampling • Process of gathering data for inference. • Why sample instead of census? • Sampling must be done in the context of study objectives. • Common sampling regimes include: • Systematic • Random • Stratified Random
Systematic Habitat B Habitat A
Random Habitat B Habitat A
Stratified Random Habitat B Habitat A
Point Counts • Point count • very common and simple sampling method • number of birds seen or heard (C) • What is the relationship between C and the bird population (N)? C = N C = a constant but unknown fraction of N
Point Counts and Detection Probability • Solution • Estimate the probability that birds are detected ( ) ˆ N Where: = the population estimate = number of birds counted = the probability that a bird is detected
Components of Detection • Pp = the probability that a bird associated with the point count area is present during the point count • Pa = the probability a bird that is present in the point count area is available for detection • Pd = the probability a bird that is present and available is actually detected = Pp Pa Pd
In any given 5 minute period, this species only uses 25% of its territory on average. The yellow area represents the portion of each territory that is occupied in this example.
In any given 5 minute period, species A has a 70% chance of being available (singing). Therefore 3 out the 10 birds shown here are not available to be counted.
Given that a bird is available, the average observer has a 71% chance of detecting it. Therefore, only 5 of the 7 available birds would be counted. The available, but undetected birds are shown in light grey.
1 4 5 3 2 Therefore, 5 sampling scenarios exist for species A with 5 minute point counts: 1) Point count is located where there is no bird. 2) Point count contains bird territory, but not the bird. 3) Point count contains bird, but bird is not singing and therefore available for detection. 4) Point count contains singing bird, but it is not detected. 5) Point count contains singing bird which is detected.
Methods That Account for the Detection Process • Distance Sampling • Multiple Observers • Independent observers • Dependent observers • Unreconciled observers • Time-of-detection • Repeated Visits • Simple counts or presence/absence
Pd Distance Methods • Distance to individual birds is measured or estimated • Sometimes distance categories are used (e.g., 0-25, 25-50, 50-100m, etc.) • Data are aggregated from point counts 1 0.75 0.50 0.25 0 0 50 100 meters
Distance Methods • Critical Assumptions • Detection probability = 1 when distance = 0 • Distances are measured accurately • Birds do not move in response to the observer prior to detection • What do you think?
Multiple Observers • Independent Observers • Observers sample same locations simultaneously and independently • Match observations when the point count is over • Matched observations, together with observations unique to each observer, provide information about each observers unique detection probability • Pd only
Multiple Observers N Observer 1 Observer 2 …after matching
Multiple Observers • Critical Assumptions • Observers do not influence each other’s detections • No matching errors • The sample area is closed to bird movements • For each observer, individual birds are not double-counted and multiple birds are not lumped into one • What do you think?
Time-of-Detection • Similar to capture-recapture methods • Point counts are divided into several intervals (e.g., 10min count split into 4 2.5min intervals) • Once a bird is detected, it is “tracked” during the remaining intervals • PaPd only
Time-of-Detection Bobwhite Interval 1 (0-2.5min) Interval 2 (2.5-5min) Interval 3 (5-7.5min) Interval 4 (7.5-10min) Bobwhite detection history = 1111 Grasshopper Sparrow detection history = 0101 Grasshopper Sparrow
Time-of-Detection • Critical Assumptions • The sample area is closed to bird movements • Birds are tracked accurately from interval to intervals • Individual birds are not double-counted and multiple birds are not lumped into one • What do you think?
Repeated Visits (Counts) • Multiple visits are made to conduct point counts • Birds are counted at each visit • Site history is generated • PpPaPd
Repeated Visits (Counts) Visit 1 Visit 2 Visit 3 Bluebird Bluebird Bluebird Bluebird Bluebird Site History = 3,0,2
Repeated Visits (Counts) • Critical Assumptions • Individual birds are not double-counted or lumped within a visit • Each individual associated with the sample area has a > 0 chance of being present at each visit • Each visit is independent of the others • What do you think?
What if you didn’t need to know how many birds where at a location (i.e., abundance)?What if all you needed to know was if the species was there (i.e., presence/absence or occupancy)?
Repeated Visits (Presence/Absence) • Multiple visits are made to conduct surveys • Presence/absence is recorded at each visit • Site history is generated • = the probability that at least one individual is detected
Repeated Visits (Presence/Absence) Visit 1 Visit 2 Visit 3 Bluebird Bluebird Bluebird Bluebird Bluebird Site History = 1,0,1
Repeated Visits (Presence/Absence) • Critical Assumptions • Occupancy status of each sample location is constant across all visits • The sample area is closed to bird movements within a visit • Each visit is independent of the others • What do you think?
Occupancy Example • Objective: Determine occupancy rate for Whispering Pine Hawk (it prefers pine forests) • Study area description • 50% loblolly, 50% Virginia pine • Previous studies suggest no preference of one pine species over another, but you think detectability may be less in Virginia pine stands • What models could you use to resolve this dilemma?
Occupancy Example • Sampling scenario • 100 point count locations • Stratified random design • Each count visited 3 times within 2 weeks
Model Selection Exercise • Get into groups of 2 • You will be presented with an image of a northern cardinal • Your task is to model that image with a pencil or pen drawing • Your drawing will be scored from 0-100 based on how likely the judge thinks others will recognize it as a cardinal • Your drawing will be penalized for the number of lines used to draw the cardinal
Model Selection Exercise • The model selection criteria is: Predictability Score – (2*number of lines) Reliability Component Parameter Penalty Component
All Bird Radio Experiments Black-throated green warbler Hooded warbler Acadian Flycatcher Yellow-throated warbler Black-and-white warbler Black-throated blue warbler Scarlet tanager Ovenbird Acadian Flycatcher Black-throated blue warbler Hooded warbler
All Bird Radio Experiments Black-throated green warbler Hooded warbler Acadian Flycatcher Yellow-throated warbler Black-and-white warbler Black-throated blue warbler Scarlet tanager Ovenbird Black-throated green warbler Acadian Flycatcher Black-and-white warbler Observer 1 Observer 2 Black-throated blue warbler Hooded warbler Hooded warbler Acadian Flycatcher Black-throated blue warbler Black-and-white warbler Black-throated blue warbler Black-and-white warbler Black-and-white warbler Scarlet tanager Black-throated green warbler Black-throated blue warbler Hooded warbler Black-throated green warbler
All Bird Radio Experiments Observer 1 Observer 2 Hooded warbler Acadian Flycatcher Black-throated blue warbler Black-and-white warbler Black-throated blue warbler Black-and-white warbler Black-and-white warbler Scarlet tanager Black-throated green warbler Black-throated blue warbler Hooded warbler Black-throated green warbler 2 Black-throated Blue Warblers 1 Black-throated Blue Warbler 1 Match
Repeated Visits (Counts) • One important caveat… • the abundance estimate doesn’t have a clear interpretation, especially with regard to area
Where do I find PRESENCE? http://www.mbr-pwrc.usgs.gov/software/doc/presence/presence.html