Download
1 / 20
200 likes | 360 Vues
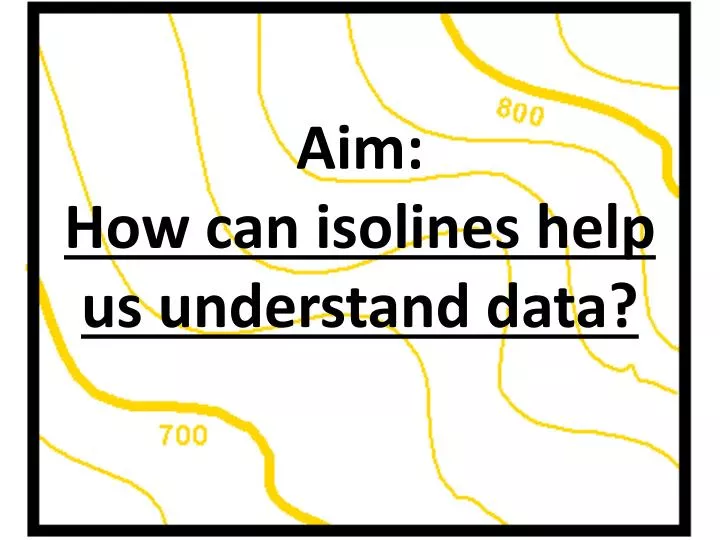
Aim: How can isolines help us understand data?. 0 - no smell 1 - very slight smell 2 - slight smell 3 - strong smell 4 - very strong smell. Kitchen. Cafeteria. Fields. Field: Any area which has measurable value of a given quantity at every point. Field maps can show levels of:

E N D
0 - no smell 1 - very slight smell 2 - slight smell 3 - strong smell 4 - very strong smell Kitchen Cafeteria
Fields Field: Any area which has measurable value of a given quantity at every point Field maps can show levels of: - Atmospheric Pressure - Temperature - Elevation - Pollutants
Rules for Drawing Isolines: 1. Isolines connect points of equal value. 5 5 10 10 10 10 15 15
Rules for Drawing Isolines: 2. Isolines are gentle, curving lines- no sharp corners. 5 5 10 10 10 10 15 15
Rules for Drawing Isolines: 3. Isolines are always closed curves even though the map might only show part of it.
Rules for Drawing Isolines: 4. Isolines NEVER cross!! This would mean that one point has two different values. Ex: one spot has two temperatures? 60 ° 50 ° 40 ° 30 ° X 20° Z Y
Gradient: Change in field value distanceExample: 12oC temperature change between two locations that are 3 km apart
Compare the gradient between points A and B to the gradient between points E and F
Contour Interval: difference between adjacent contour lines (how much lines go up by)