Download
1 / 8
110 likes | 345 Vues
The Statistical Enquiry Cycle Step 4: Analysis Comparing Box Plots – is there a difference?. Lesson Objective. To learn how to compare box plots and determine if a difference exists. Lesson Success Criteria.

E N D
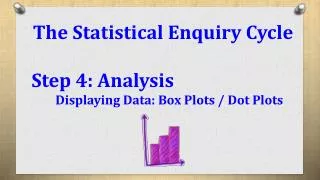
The Statistical Enquiry Cycle • Step 4: Analysis • Comparing Box Plots – is there a difference?
Lesson Objective To learn how to compare box plots and determine if a difference exists Lesson Success Criteria • Can review a data’s box plots and make a judgement call on whether there is a statistical difference between two groups
Comparing Box Plots The purpose of our investigation is to find out if there is a difference between two samples of data. The final part of the analysis stage is to compare our two box-plots and make a final statement in relation to our original question; i.e. is sample A larger than sample B?
Comparing Box Plots 1. No overlap of boxes A B • We can say that “There is a difference between A and B” • Upper quartile of one subgroup (A) is below the lower quartile of the other subgroup (B) • 75% of one sample is above / below 75% of the second sample
Comparing Box Plots 2. Boxes overlap – median of 1 group outside middle 50% A B • We can say that “There is a likely to be a difference between A and B” • Upper quartile of one subgroup (A) is below the median of the other subgroup (B) • 75% of one sample is above / below 50% of the second sample
Comparing Box Plots 3. Boxes overlap – medians between 50% spreads A B DBM DBM = difference between medians OVS OVS = overall visible spread = UQ(largest) – LQ(smallest) • We can say that there is likely to be a difference if • Otherwise we say that “there is no difference”
Comparing Box Plots 4. Boxes overlap – medians very close together A B • We can use previous method of checking DBM/OVS x 100 >33% for confirmation • However, if very close, then we can say “as the medians are very close, I cannot tell which is the bigger, therefore there is no significant difference between the two groups”
Practice Chapter 7: page 239 Exercise F : Box Plots Exercise E : Stem and Leaf Plots (if interested)