Download
1 / 22
230 likes | 402 Vues
Infrasound from lightning. Jelle Assink and Läslo Evers Royal Netherlands Meteorological Institute Seismology Division. ITW 2007, Tokyo, Japan. Lo w F requency Ar ray. Astronomical initiative Infrastructure ao. power, internet, computing and backup facilities

E N D
Infrasound from lightning Jelle Assink and Läslo Evers Royal Netherlands Meteorological Institute Seismology Division ITW 2007, Tokyo, Japan
Low Frequency Array • Astronomical initiative • Infrastructure ao. power, internet, • computing and backup facilities • Dense (international) coverage • Geophysical sensor network • Combined seismic/infrasound • recording LOFAR
Objectives • Source identification through association • Atmospheric contribution to seismic noise • Seismo-acoustics by simultaneous observations • Local noise characterization Practicalities • Adapt KNMI microbarometer for periods up to1000 s • Construct Very Large Aperture Infrasound Array • 30 KNMI-mb’s at 1 to 10s of km • Develop low cost infrasound sensor • Construct High Density Infrasound Array • 80 sensor in 100x100 meter field LOFAR
Cabauw Infrasound Array • Combined meteo and • infrasound project • Cabauw site: 215 m meteo • tower • 3D sensing of the boundary • layer
Objectives • Detect gravity waves and other atmospheric • phenomena • Applying infrasound technique to non-acoustic • velocities • Relation between state of the boundary layer and • infrasonic signal characteristics • 3D acoustical array for signal characterization as • function of height 50 km Source: NASA
Objectives • Detectability lightning discharges with infrasound • To which extent • Distinction CC/CG • Source localization • Content and behavior of related infrasound • Possible source-mechanisms • Wave propagation paths through atmosphere • Comparison and verification KNMI lightning detection network based on EM (‘FLITS’)
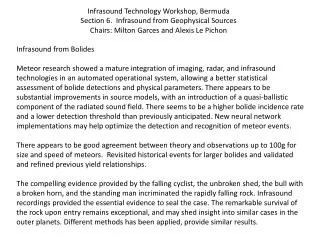
Source mechanisms • Few (1969): thermally driven expanding channel model, blast wave • Bowman and Bedard (1971): convective system as a whole, vortices, mass displacement • Dessler (1973): electrostatic mechanism, reordering of charges within clouds • Liszka (2004): transient luminous events, such as sprites
LF antenna (around 4 MHz) VHF array (around 110 MHz) Electromagnetic detection KNMI FLITS network
Electromagnetic detection • FLITS: Flash Localisation by Interferometry and Time of Arrival System • LF Antenna: Time-of-Arrival • Detection and localization • Discrimination CC/CG • VHF array: interferometry • Detection and localization • A minimum of 4 stations for unambiguous detections
Infrasound detection KNMI IS network
Electromagnetic detections at 01-10-2006 Cloud-to-Cloud discharge CC Cloud-to-Ground discharge CG
CG CC High F IS Low F IS Infrasound & FLITS detections at DBN for 1-10-2006
All-day observation summary • Correlation in time between (nearby) discharges and coherent infrasound detections • Nearby discharges: • High app. velocity • High amplitude • Coherent energy over infrasound frequency band
Unfiltered data, strong front nose Raw data Pressure(Pa) Time(s)
Bandpass 1-10 Hz, variety of impulsive events Filtered data Pressure(Pa) Time(s)
Bandpass 1-10 Hz, blast waves Filtered data Pressure(Pa) Time(s)
Atmospheric attenuation Infrasound amplitude vs. distance from array • Normalized for discharge size • Empirical attenuation relation: exponentially decaying?
Atmospheric attenuation Log-log presentation
Atmospheric attenuation Power coefficient = 1 for cylindrical spreading = 2 for spherical spreading
Conclusions • CG discharges can be detected over ranges of 50 km, CC much harder to identify • Thermally driven expanding channel model seems feasible, correlation with blast waves • Small arrays needed for detection, 25-100 meters inter-station distance • Attenuation: near-field infrasound indication for point source • far-field cylindrical spreading
What propagation path allows 0.36 km/s? Non-tropospheric velocity of 420 m/s between DBN and DIA Head wave like propagation in high velocity acoustic channel Strong winds cause high propagation velocity, large azimuthal deviations and steep incident angles Detection and parameter estimation results Either high apparent velocity and large azimuthal deviation or low apparent velocity and small azimuthal deviation