Download
1 / 28
280 likes | 453 Vues
Study of Infant Mortality TRICARE Beneficiaries Fort Riley, Kansas. LTC Paul Benne, MD, MPH SPC John Makinwa, BS, MBA, DrPH Candidate November 2011. Objectives. Update of infant mortality in Kansas Describe the Infant Mortality Rate (IMR) of the Fort Riley area Discuss contributors to IMR

E N D
Study of Infant MortalityTRICARE BeneficiariesFort Riley, Kansas LTC Paul Benne, MD, MPH SPC John Makinwa, BS, MBA, DrPH Candidate November 2011
Objectives • Update of infant mortality in Kansas • Describe the Infant Mortality Rate (IMR) of the Fort Riley area • Discuss contributors to IMR • Discuss possible community collaboration
Definitions • Two calculations methods of Infant Mortality Rate: 1. Simplest, universally adopted method = Infant deaths in a given year divided by the total number of live births in the same year multiplied by 1,000 - Cross-sectional data - Data/statistics presented in the KDHE, Bureau of Epidemiology and Public Health Informatics’ Annual Summary and Kansas Information for Communities (KIC)
Definitions Cohort rate = Infants born in a given year are followed through their first birthday and the number of deaths that occur to these infants are noted and used as the numerator for the cohort IMR (linked births-deaths file) - Birth cohort – Birth for a given year are linked with infant deaths that occurred in the year of birth or the next year. - Death cohort – Deaths for a given year are linked with births that occurred in the same year or previous year. Numbers using different methodologies will not match
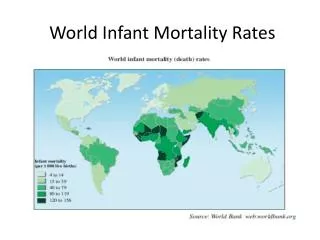
Infant Mortality Rates 2011 • 2011 projected IMR in US 6.1 (CIA) • There are 46 governments that have better IMRs • US rates are higher than many third world countries
Infant Mortality Trends2000-2009 U.S. 2008, 2009 preliminary data Source: Bureau of Epidemiology and Public Health Informatics, KDHE; National Center for Health Statistics
Infant Mortality Rates by Race2007 Source: National Vital Statistics Report: Volume 58, Number 19
Kansas Ranked Worst among States for Black Infant Mortality Rate (IMR), 2007 Source: National Vital Statistics Report: Volume 58, Number 19
Black non-Hispanic and White non-Hispanic Infant Mortality Rates & Ratio, 1998-2009 *NH: Non-Hispanic Source: Bureau of Epidemiology and Public Health Informatics, KDHE
Infant Deaths by Cause of DeathKansas, 2005-2009 Source: Bureau of Epidemiology and Public Health Informatics, KDHE
Births and Deaths by Gestational Age, KS 2005-2009 AverageAll Races Pre-term = 10% Pre-term=61% Live Births Deaths Premature babies: 10% of births, BUT 61% of deaths! Source: Bureau of Epidemiology and Public Health Informatics, KDHE
How old are babies when they die? Neonatal deaths (= <28 days old) are more common than post-neonatal deaths in all races and ethnicities This distinction is less important today LBW and prematurity more important than the age of the baby Source: Bureau of Epidemiology and Public Health Informatics, KDHE
Our Question Based on cross-sectional data, 2005 to 2009 : Kansas IMR 7.37/1,000 live births (CI95 7.00-7.74) Fort Riley (TRICARE) IMR ? Geary/Riley County IMR 8.50/1,000 live births (CI95 6.69-10.66) 92% of Fort Riley TRICARE births occur to residents of either Riley or Geary County Source: Bureau of Epidemiology and Public Health Informatics, KDHE
Study Subjects TRICARE beneficiaries live births in Fort Riley, Kansas area (2005- 2009) N= 4715 Beneficiaries included resident live births where TRICARE was the delivery payor (2005-2009) .
Fort Riley Area defined as: Total Live Births 4715
Characteristics of Fort Riley, KS TRICARE Beneficiaries (2005-2009)
Characteristics of Fort Riley, KS TRICARE Beneficiaries (2005-2009)
Characteristics of Fort Riley, KS TRICARE Beneficiaries (2005-2009)
Analysis of Direct and Network Births Fort Riley, KS (2005-2009) Source: Medical Management Database, Irwin Army Community Hospital
Infant Mortality Rate:TRICARE Beneficiaries at Fort Riley Area, KS 2005-2009 Live births = 4715 Deaths = 35 IMR = 35 / 4715 *1000 = 7.42 CI95 (5.17 - 10.32) Infant death= Death of an infant before his or her first birthday Infant mortality rate= Number of infant deaths per 1,000 live births.
Average Infant Mortality Rates (IMR) for Fort Riley TRICARE Beneficiaries with Delivery on Post vs. Off-Post (2005-2009)Live Births= 4,715 Delivery Location Live Births Deaths IMR (CI95) Post (Irwin) 3,660 18 4.92 (2.91 - 7.77) Off -Post (Other) 1,055 17 16.11 (9.39 - 25.8)
Kansas Ranked Worst among States for Black Infant Mortality Rate (IMR), 2007 Source: National Vital Statistics Report: Volume 58, Number 19
Infant Mortality Rate: TRICARE beneficiaries at Fort Riley Area, KS 2005-2009 Black NH Live births = 507 IMR = 18.98 Projected Deaths = 9 Observed Deaths = 1 Infant death = Death of an infant before his or her first birthday Infant mortality rate = Number of infant deaths per 1,000 live births.
Military Infant Mortality Rate • Kansas TRICARE IMR (birth cohort): • 5.77/1,000 live births CI95 (4.25- 7.64) • Other study has had consistent finding of reduced Black NH infant deaths (rate cut in half)* • Research focusing on possible sociologic effect of military culture * Hicks Lundquist et al, Race and Preterm Births: A Protective Effect of the Military? National Science Foundation SES 0751505, publish pending
Summary KS IMR is higher than in most other states Rates are higher in KS than U.S. for all race and ethnic groups (especially Black NH) Causes of infant deaths mimic those in other states: Prematurity and LBW are key factor Fort Riley facility IMR significantly lower although high risk referred outside facility Protective effect against infant mortality particularly for Black NH in the military setting and consistent with other study on preterm delivery
Support Partner Programs • Kansas Blue Ribbon Panel on Infant Mortality • PPOR analysis from KDHE • FIMR programs in the state • March of Dimes • Prematurity conference • Prematurity Coalition • SIDS Network of Kansas • Safe Sleep video • Presentation at Conferences KAAP, KAFP
Acknowledgements: SPC John Makinwa US Army, Fort Riley Mr. Greg Crawford Ms. Jamie Kim Ms. Carol Moyer Kansas Department of Health and Environment Dr. Dennis Cooley Kansas Blue Ribbon Panel on Infant Mortality Point of Contact for Study: Paul Benne, MD, MPH Lieutenant Colonel, Medical Corps 600 Caisson Hill Rd Fort Riley, KS 66442 785 239 7323