Download
1 / 50
520 likes | 575 Vues
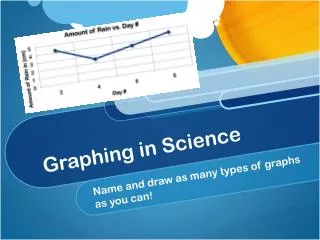
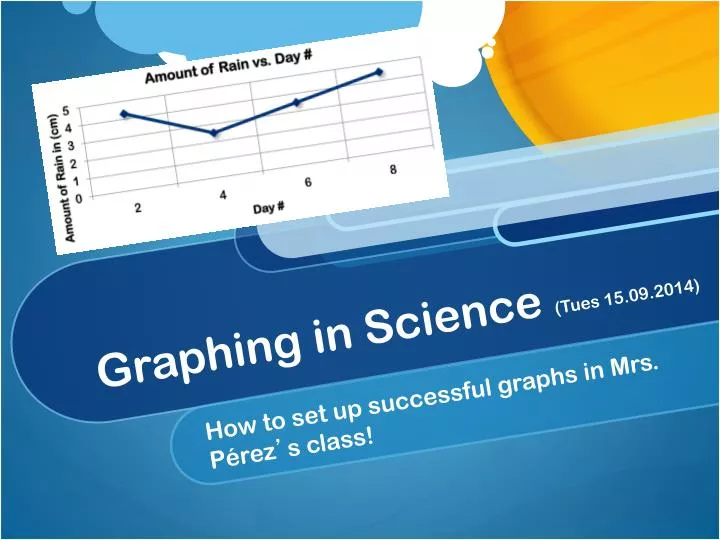
Graphing in Science (Tues 15.09.2014). How to set up successful graphs in Mrs. Pérez ’ s class!. Clear Learning goal. Students will: (1) Communicate data through tables and graphs. (2) Create appropriate graphs based on data. How to set up your graph!. How to set up your graph!.

E N D
Graphing in Science (Tues 15.09.2014) How to set up successful graphs in Mrs. Pérez’s class!
Clear Learning goal Students will: (1) Communicate data through tables and graphs. (2) Create appropriate graphs based on data.
How to set up your graph! Y Axis (This is for your dependent variable)
How to set up your graph! X Axis (This is for your independent variable)
Want to get a 100% use:TAILS T: Title A: Axis I: intervals L: labels S: scale
Want to get a 100% use:TAILS Teachers’s Favorite Singer T - Title
TAILS Teachers’s Favorite Singer T - Title A – Axis title Y Axis = Dependent Variable X Axis = Independent Variable
TAILS T – Title A – Axis I – Interval S – Scale The amount of space between one number and the next The interval is just as important as the scale Choose an interval that lets you make the graph that fits in your paper.
How to determine Intervals The interval is decided by your scale. In this case your scale would be from 2 – 22 and you want the scale to fit the graph. The best interval would be to go by 5’s. Favorite Singer Number of Teachers Toby Keith 22 Madonna 15 Elvis 11 Sting 5 Sinatra 2
TAILS Favorite Singer Number of Teachers Toby Keith 22 Madonna 15 Elvis 11 Sting 5 Sinatra 2 Teachers’s Favorite Singer 25 20 15 T – Title A – Axis I – Interval S – Scale 10 5 0
TAILS Decide on an appropriate scale for each axis. Choose a scale that lets you make the graph as large as possible for your paper and data T - Title A – Axis S – Scale
How to determine scale Scale is determined by your highest & lowest number. In this case your scale would be from 2 – 22. Favorite Singer Number of Teachers Toby Keith 22 Madonna 15 Elvis 11 Sting 5 Sinatra 2
LABEL your bars or data points TAILS Teachers’s Favorite Singer T – Title A – Axis I – Interval L – Labels S – Scale 25 20 15 Number of Teachers 10 5 0 Toby Keith Madonna Elvis Sting Sinatra Singers Label the bar using you DV data of you table an color according to your data. Give the bars a general label. What do those words mean?
Let’s see if you are ready for tomorrow Graph Test. Wednesday, September 17
1. What are the parts of a graph? A: main title B: Y axis DV variable C: X axis IV variable D: scales/interval A D B C
2. Name the part of the graph? Y axis or Dependent Variable (DV)
3 Main title
4 Scale/interval Look the numbers not the title
5 Bar graph.
6 Labels Look the colors not the title
7 X axis or Independent Variable (IV)
8. What hour was more hot? 11:00 am to 1:00 pm
9. Pick a correct scale 100 by 100 500 400 300 200 100
10. What is the IV? Types of pizza
11. What is the DV? # of votes
12. What is missing? • X • Y • ID • IV
13. Pick a correct scale 2 by 2 10 8 6 4 2
15. What type of graph is? Line graph
17. What would the title of the graph be? Average TV hours Vs. Students homework's.
18. Write a conclusion about hours students see TV and Homework's tuned in. I need to see less TV to make my homework.
19. Write a Hypothesis about hours students see TV and Homework's tuned in. If I see more TV then I can’t turn my homework. If I see less TV then I can turn my homework.
22. X axis is the ________ • Control group • Dependent variable • Independent variable • scale
24. Y axis is the ________ • Control group • Dependent variable • Independent variable • scale
25 On what day did they sell the most chocolate milk?
26. Pick a correct scale 5 by 5 25 20 15 10 5
28. Pick a correct scale 3 by 3 15 12 9 6 3
29 On what day was the least amount of chocolate milk sold?
30 On what day did they have a drop in chocolate milk sales?
31. A variable that never changes and let us compare. • Control group • Dependent variable • Independent variable • scale
32. What type of graph is? Bar grahp
34. What scale it’s use? 1 by 1 5 4 3 2 1
What king of graph is? pictograph