Download
1 / 16
160 likes | 403 Vues
Hospital Pricing Behavior for the Uninsured: Are Safety-Net Hospitals Different?. Katya Fonkych, MPhil Glenn Melnick, PhD RAND Corporation. This study is funded in part by Robert Wood Johnson Foundation under the HCFO Program. June 27, 2006. Background .

E N D
Hospital Pricing Behavior for the Uninsured: Are Safety-Net Hospitals Different? Katya Fonkych, MPhil Glenn Melnick, PhD RAND Corporation This study is funded in part by Robert Wood Johnson Foundation under the HCFO Program June 27, 2006
Background • Rapid increase in hospital charges (list prices) • Charges per day doubled from 2000 to 2004 • Growing billed charges were ignored: • Managed care allowed for steep discounts • PPS fixed the real prices for government • Self-pay (SP) patients receive bills based on list prices (charges) and many are expected to pay them • Media coverage
Research Questions • Do hospitals collect higher proportion of charges from self-pay patients than from insured patients? • Do safety net hospitals give more or less of a discount for self pay patients compared to non-safety net hospitals? Which safety-net dimensions matter for pricing: • Government subsidies for safety-net providers • Hospitals that treat the largest uninsured population • Non-profit status
Data and Methods • Hospital data for descriptive and multivariate analyses • California annual financial reports on acute-care hospitals: • Gross charges and net (received) revenue by payor class • Non-comparable hospitals excluded: • County, State, Psychiatric and Kaiser hospitals, hospitals with < 50 uninsured patients • Key dependent variables Collection percentage by payor class, within a hospital: Difference in collection percentage bw self pay and insured ~ discount or relative price for SP patients, because: Gross charges are about the same for patients in same hospital regardless of their payor (we checked top 20 DRG category ) % Paid (payor)= Net Revenue (payor) / Gross Charges (payor) Δ Paid (com. insured) = %Paid (self-pay) - %Paid (com. insured)
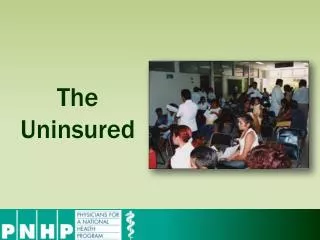
Measurement of Self-Pay versus Low Income Uninsured Ideally we would like to identify low-income, uninsured, self pay patients, but our SP data may include: • International or out of state high-income patients • 0.6% of self-paid come out of US, vs. 0.1% among all payors • High income patients seeking elective procedures, not covered by their insurance • Self-paid patients are mostly admitted through ER, unlike commercially insured (ER is unlikely to be elective): 70% vs 40% • Misclassified auto accident patients, who pay their bill from auto insurance coverage • However only 12% of all accidents are self-paid • Insured patients whose charges are misclassified as SP initially or SP patients that are misclassified as insured
About One in 20 Patients Is Self-Pay (CA, 2004) 1.36 million 3.42 million 135 thousand All acute-care Californian hospitals, excluding psychiatric Adjusted days = inpatient days and outpatient care, weighted by their relative charges
By 2004 SP Patients Paid Less Than Insured But More Than Government • % Paid = Net Revenue / Gross Charges • in a given hospital (hospital-level, not patient-level)
Difference in Collection Rates BW Self Pay and Commercially Insured, 2004 • Mean ΔPaid • -5.4% • 1/3 of hospitals that treat 1/3 of self-pays on average collect from them more than from their commercially insured patients
Dimensions of Safety Net: Disproportionate Share Hospitals • Hospitals that qualify for “Disproportionate Share” payment from Medicaid treat high share of low-income patients • Whether or not qualify • % revenue from DSH payments • In CA DSH hospitals must have > 25% of care provided for low-income patients, defined as indigent and Medical • weighted towards Medical • In CA 29% of hospitals receive DSH payments (county excluded), account for only 25% of care for self-pay patients • Profit status is another dimension of safety net: • Non-profit hospitals are supposed to provide indigent care to justify their non-profit status and fulfill their mission
Dimensions of Safety Net: Hospitals with Most Self-Pay Patients • Defined Safety-Net hospitals for Self-Pay, as those that provide most access to care for uninsured (top 25% of adjusted days) • Top 25% of hospitals (82 hospitals) provide 70% of SP care • Only a third of top 25% hospitals (29 hospitals) are DSH => little overlap Safety Net for Self-pays
Safety-Net Hospitals Do Not Provide Greater Discounts for SP Patients But non-profits do
Multivariate Model SN hospitals have different characteristics, which might be responsible for the difference in ΔPaid : patient distribution, profit and teaching status etc. • Dependent Variable: • ΔPaid (insured) = %Paid (self-pay) - %Paid (insured) • Independent Variables • Safety net measures (DSH hospital & % revenues from DSH, Top 25% SP, For-Profit, DSH*For-Profit) • SP adjustments: % homeless, % SP accidents, % out of state • Patient distribution: Outpatient SP Share, Share of commercial patients • Hospital characteristics: Bed Size, Rural, Teaching, Profit Margin from previous year
Estimated Effects on ΔPaid(Relative Price to Self-Pay Patients) SN Hospitals did not offer higher discounts to SP compared to non-SN hospitals (CA, 2004, county hospitals excluded) * significant at 10% ** significant at 5%
For-profit DSH Non-DSH Non-DSH DSH Non-profit Subsidy Doesn’t Help to Reduce “Relative Price” for SP Patients Difference in % Paid bw Self-paid and Commercial is higher in DSH hospitals (for av. DSH payment of 6%) than in non-DSH, for both for-profit and non-profit hospitals 14% 6% 8.5%
Summary of Findings • Self-pays used to pay the highest average % of gross charges in 2000, but in 2004: • On average SP paid a bit less than commercially insured (-5.4%) • But in a third of hospitals, self-pays still pay on average more than commercially insured patients. • SN providers do not provide bigger discounts to SP patients compared to other hospitals; • An average SN hospital have smaller discount than non-SN • This includes DSH and Top SP hospitals • But non-profits do provide discounts (additional 11% of charges) • Hospitals that provide most care for self-pays rarely get government DSH subsidy • official “safety net” is hardly a safety net for self-pays
Policy Issues • Should we expect DSH provider to offer bigger discounts for uninsured in return for getting a subsidy? • The hospitals where most SP patients receive their care have higher relative prices than the rest of the hospitals • Should those hospitals receive additional financial support for caring for uninsured, as DSH often doesn’t target them? • Should there be regulatory or social pressure to limit prices to the uninsured?