Download
1 / 13
140 likes | 297 Vues
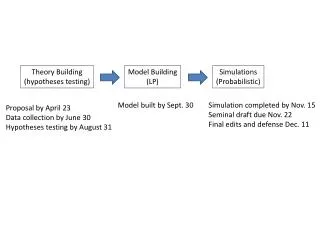
Building and Testing a Theory Steps 1-4. Decide on what it is you want to explain or predict. Identify the variables that you believe are important to what you want to explain or predict. State the assumptions of the theory. Ceteris Paribus - A Latin term meaning “all things held constant.”

E N D
Building and Testing a TheorySteps 1-4 • Decide on what it is you want to explain or predict. • Identify the variables that you believe are important to what you want to explain or predict. • State the assumptions of the theory. Ceteris Paribus - A Latin term meaning “all things held constant.” • State the hypothesis
Building and Testing a TheorySteps 5-6 • Test the theory by comparing its predictions against real-world events. • If the evidence supports the theory, then no further actions is generally taken. If the evidence rejects the theory, then • you can conclude the theory is incorrect. • you can conclude the data is inadequate. Step 6 teaches a valuable lesson – We do not learn the “truth” via econometrics.
Econometrics Defined • Econometrics - the social science in which the tools of economic theory, mathematics, and statistical inference are applied to the analysis of economic phenomena. • Econometrics is defined literally as “economic measurement” • Quantitative analysis of actual economic phenomena.
Uses of Econometrics • Describing Economic Reality • Testing Hypothesis about Economic Theory • Forecasting Future Economic Activity
Regression Analysis Defined A statistical technique that attempts to “explain” movements in one variable as a function of movements in a set of other variables. Dependent variable – what we wish to explain. Independent variable – what we believe explains movements in the dependent variable.
Correlation vs .Causation Regression analysis tells us that variables move together. In other words, it tells us about correlation. Regression analysis does not “prove” causation. Causation is “established” via the combination of regression analysis and economic theory.
Hypothesis Testing • Hypothesis Testing – Statistical experiment used to measure the reasonableness of a given theory or premise • NOTE: WE DO NOT “PROVE” A THEORY • Type I Error – Incorrect rejection of a ‘true’ hypothesis. • Type II Error – Failure to reject a ‘false’ hypothesis.
Deterministic Relations vs. Statistical Relations • Deterministic Relation = An identity • A relationship that is known with certainty. • Statistical Relation – An inexact relation
Regression AnalysisTypes of Data Time series – A daily, weekly, monthly, or annual sequence of data. i.e. GDP data for the United States from 1950 to 2005 Cross-section – Data from a common point in time. i.e. GDP data for OECD nations in 1995. Panel data – Data that combines both cross-section and time-series data. i.e. GDP data for OECD nations from 1960 to 2000.
Regression Math E(Y|Xi) = α + βXi In words…. the expected value of Y for given values of Xi is equal to a linear function of X. OR…. Y = Β0 + Β1X1 Where Y = The Dependent Variable, or what you are trying to explain (or predict). X = The Independent Variable, or what you believe explains Y. Β0 = the y-intercept or constant term. Β1 = the slope coefficient Linear vs. Non-linear equations
The Stochastic Error Term • Y = Β0 + Β1X1+ ε • Stochastic error term (ε) = disturbance term = a term that is added to a regression equation to introduce all of the variation in Y that cannot be explained by the included Xs. • Stochastic = Random • Sources of error term • Omitted variables • Measurement error • Incorrect functional form • Unpredictable or purely random variation
Interpretation • Interpreting a regression coefficient • the impact of a one unit change in X on the dependent variable Y, holding constant the other included independent variables. • This is how we do controlled experimentation in economics • If a variable is not included, then we have not controlled for this factor.
Estimated Regression Equation • Population Regression Function (PRF) vs. a Sample Regression Function (SRF) • True regression coefficients vs. Estimated regression coefficients. • Residual – difference between the observed Y and the estimated regression line. • Error term – difference between the observed Y and the true regression equation. • Error term is theoretical and never observed.