Download
1 / 20
200 likes | 360 Vues
The Practice of Statistics. Section 1 : Density Curves and the Normal Distribution. Chapter 2: The Normal Distribution. A density curve is similar to a histogram, but there are several important distinctions.

E N D
The Practice of Statistics Section 1: Density Curves and the Normal Distribution Chapter 2: The Normal Distribution
A density curve is similar to a histogram, but there are several important distinctions. 1. Obviously, a smooth curve is used to represent data rather than bars. However, a density curve describes the proportions of the observations that fall in each range rather than the actual number of observations. 2. The scale should be adjusted so that the total area under the curve is exactly 1. This represents the proportion 1 (or 100%). Density Curves
3. While a histogram represents actual data (i.e., a sample set), a density curve represents an idealized sample or population distribution. Density Curves
Three points that have been previously made are especially relevant to density curves. 1. The median is the "equal areas" point. Likewise, the quartiles can be found by dividing the area under the curve into 4 equal parts. 2. The mean of the data is the "balancing" point. 3. The mean and median are the same for a symmetric density curve. Density Curves: Mean & Median
Since the density curve represents "idealized" data, we use Greek letters: mu m for mean and sigma s for standard deviation. Greek 101
We have mostly discussed right skewed, left skewed, and roughly symmetric distributions that look like this: Shapes of Density Curves
We could have a bi-modal distribution. For instance, think of counting the number of tires owned by a two-person family. Most two-person families probably have 1 or 2 vehicles, and therefore own 4 or 8 tires. Some, however, have a motorcycle, or maybe more than 2 cars. Yet, the distribution will most likely have a “hump” at 4 and at 8, making it “bi-modal.” Bimodal Distributions
We could have a uniform distribution. Consider the number of cans in all six packs. Each pack uniformly has 6 cans. Or, think of repeatedly drawing a card from a complete deck. One-fourth of the cards should be hearts, one-fourth of the cards should be diamonds, etc. Uniform Distributions
Many other distributions exist, and some do not clearly fall under a certain label. Frequently these are the most interesting, and we will discuss many of them. Other Distributions
Curves that are symmetric, single-peaked, and bell-shaped are often called normal curves and describe normal distributions. All normal distributions have the same overall shape. They may be "taller" or more spread out, but the idea is the same. Normal Curves
The "control factors" are the mean μ and the standard deviation σ. Changing only μ will move the curve along the horizontal axis. The standard deviation σ controls the spread of the distribution. Remember that a large σ implies that the data is spread out. Normal Curves: μ and σ
You can locate the mean μ by finding the middle of the distribution. Because it is symmetric, the mean is at the peak. The standard deviation σ can be found by locating the points where the graph changes curvature (inflection points). These points are located a distance σ from the mean. Finding μ and σ
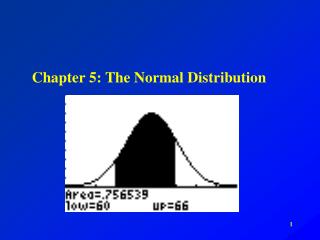
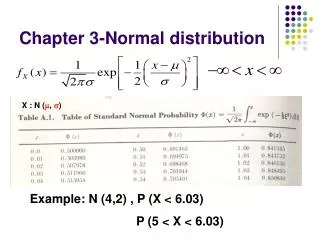
In a normal distribution with mean μ and standard deviation σ: • 68% of the observations are within σ of the mean μ. • 95% of the observations are within 2 σ of the mean μ. • 99.7% of the observations are within 3 σ of the mean μ. The 68-95-99.7 Rule
1. They are occur frequently in large data sets (all SAT scores), repeated measurements of the same quantity, and in biological populations (lengths of roaches). 2. They are often good approximations to chance outcomes (like coin flipping). 3. We can apply things we learn in studying normal distributions to other distributions. Why Use the Normal Distribution???
The distribution of heights of young women aged 18 to 24 is approximately normally distributed with mean = 64.5 inches and standard deviation = 2.5 inches. Heights of Young Women
Where do the middle 95% of heights fall? What percent of the heights are above 69.5 inches? A height of 62 inches is what percentile? What percent of the heights are between 62 and 67 inches? What percent of heights are less than 57 in.? Use the previous chart...
However, NOT ALL DATA are normal or even close to normal. Salaries, for instance, are generally right skewed. Nonnormal data are common and often interesting. But...