Download
1 / 20
200 likes | 308 Vues
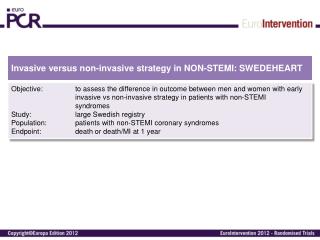
Long-Term Outcome of a Routine versus Selective Invasive Strategy in Patients with non-ST elevation ACS . Keith AA Fox, Tim C Clayton, Peter Damman, Stuart J Pocock, Robbert J de Winter, Jan GP Tijssen, Bo Lagerqvist, Lars Wallentin. FIR collaboration: F RISC I CTUS R ITA.

E N D
Long-Term Outcome of a Routine versus Selective Invasive Strategy in Patients with non-ST elevation ACS Keith AA Fox, Tim C Clayton, Peter Damman, Stuart J Pocock, Robbert J de Winter, Jan GP Tijssen, Bo Lagerqvist, Lars Wallentin FIR collaboration: FRISC ICTUS RITA
ACC/AHA Recommendations for Invasive and Medical Strategies in Patients with NSTE-ACS • Class I • An early invasive strategy in patients with high-risk indicators • In the absence of any of the above high-risk indicators, either an early conservative or an early invasive strategy • Class IIb Level of Evidence: B • In initially stabilized patients a selectively invasive strategy may be considered as a treatment strategy Available at www.acc.org/clinical/guidelines/unstable/unstable.pdf.
Routine versus selective intervention in ACS European Heart Journal (2007) 28, 1598–1660 Early invasive strategy: OR 0.84 (95% CI 0.73-0.97)
RITA-3: 5-year mortality FRISC II: 5-year mortality n = 2457 RR 0.95 (95%CI: 0.75-1.21, p=0.693) Selective invasive ICTUS: 5-year mortality HR 1.13 (95%CI: 0.80-1.60, p=0.52) n = 1190 Routine invasive Routine invasive Selective invasive n = 1810 OR 0.76 (95%CI: 0.58-1.00, p=0.054) Selective invasive Routine invasive
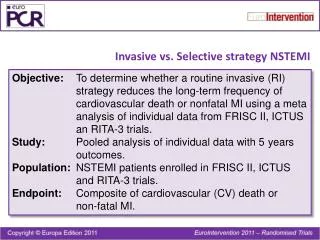
Short-term outcomes (up to one year) showed a net benefit (death/MI) , but long term outcomes were inconsistent in individual studies • Aims of the Meta-analysis: • To determine whether; • A routine invasive strategy reduces cardiovascular death • or MI using a meta-analysis of individual patient data from • all randomised studies with 5 year outcome • The results are influenced by baseline risk of the patients
FIR patient-pooled database • Core variables: • Demographics • Clinical history • Risk factors for CAD • Baseline ECG characteristics • Baseline laboratory results • 5-year clinical outcomes • 5467 patients with nSTE-ACS included
Procedures • Routine invasive strategy • “Early” angiography with subsequent PCI or CABG • Selective invasive strategy • Angiography only if refractory angina or rest ischemia occurs despite optimal medical therapy
Timing of first coronary revascularization 100 Selective invasive Routine invasive 80 60 Cumulative percentage 40 20 0 0 1 2 3 4 5 Follow-up time (years) 64.1% 71.8% 73.3% 17.6% 41.6% 47.8%
Primary outcomes at 5 years Table 2: Outcomes by study and treatment
Outcomes at 5 years Table 2: Outcomes by study and treatment
Meta-analysis for CV death or MI Study Hazard ratio (95% CI) FRISC-II (N=2457) 0.79 (0.66, 0.95) 0.79 (0.66, 0.95) RITA-3 (N=1810) 0.75 (0.58, 0.96) 0.75 (0.58, 0.96) ICTUS (N=1200) 0.99 (0.72, 1.35) 0.99 (0.72, 1.35) Overall 0.81 (0.71, 0.93) 0.81 (0.71, 0.93) 0.5 0.75 1 1.33 2 Favors routine invasive Favors selective invasive Hazard ratio
Cumulative risk of CV death or MI 25 Selective invasive Routine invasive 20 15 Cumulative percentage 10 5 0 0 1 2 3 4 5 Follow-up time (years) SI 2746 2452 2351 2178 2077 1880 RI 2721 2485 2410 2235 2166 1952 17.9% 14.7% HR 0.81 95% CI 0.71-0.93 p = 0.002
Are the results influenced by the baseline risk of the patients? • Univariable and multivariable predictors of outcome derived (Cox regression). p<0.01 for inclusion in multivariable model (Wald test) • Simplified integer score derived: • Age, diabetes, prior MI, ST depression, hypertension, BMI
Cumulative risk of CV death or MI by risk group 50 Selective invasive Routine invasive 40 30 Cumulative percentage 20 10 0 0 1 2 3 4 5 Follow-up time (years) SI 2746 2452 2351 2178 2077 1880 RI 2721 2485 2410 2235 2166 1952 Intermediate Low
Cumulative risk of CV death or MI by risk group 50 Selective invasive Routine invasive 40 High 30 Cumulative percentage Intermediate 20 Low 10 0 0 1 2 3 4 5 Follow-up time (years) SI 2746 2452 2351 2178 2077 1880 RI 2721 2485 2410 2235 2166 1952
Cumulative risk of MI by risk group 50 Selective invasive Routine invasive 40 30 Cumulative percentage High 20 Intermediate 10 Low 0 0 1 2 3 4 5 Follow-up time (years) SI 2746 2452 2351 2178 2077 1880 RI 2721 2485 2410 2235 2166 1952
Probability of CV death or MI at 5 years 70 Predicted risk on selective invasive Predicted risk on routine invasive 60 50 40 Risk of CV death or MI within 5 years 30 ROC statistic 0.69 20 10 0 0 1 2 3 4 5 6 7 8 9 10 11 12 13 14 15 Integer score Integer score components : age 0-5: Diabetes 0-4: Hypertension 0-1: ST depression 0-2: BMI 0-2
Treatment Effect by Integer Risk Category: Cardiovascular Death or MI
Summary • The routine invasive strategy reduces cardiovascular death or MI at long-term follow-up • 3.2% absolute risk reduction in CV death/MI • 19% relative risk reduction • Risk stratification identifies the patient group with the greatest absolute benefits • 11.1% absolute risk reduction in highest risk patients • The absolute risk reductions in CV death/MI in low (2.0%) and Intermediate groups (3.8%) exceed those seen in many trials of pharmacological agents