Download
1 / 28
280 likes | 413 Vues
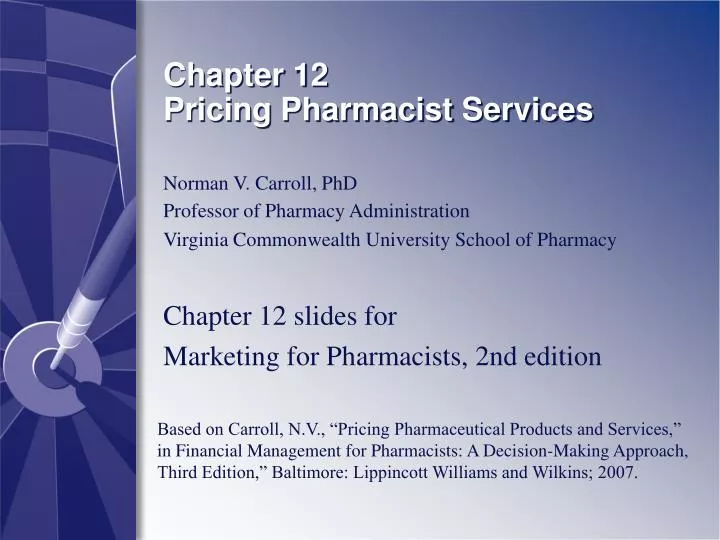
Chapter 12 Pricing Pharmacist Services. Norman V. Carroll, PhD Professor of Pharmacy Administration Virginia Commonwealth University School of Pharmacy Chapter 12 slides for Marketing for Pharmacists, 2nd edition.

E N D
Chapter 12Pricing Pharmacist Services Norman V. Carroll, PhD Professor of Pharmacy Administration Virginia Commonwealth University School of Pharmacy Chapter 12 slides for Marketing for Pharmacists, 2nd edition Based on Carroll, N.V., “Pricing Pharmaceutical Products and Services,” in Financial Management for Pharmacists: A Decision-Making Approach, Third Edition,” Baltimore: Lippincott Williams and Wilkins; 2007.
Learning Objectives • Explain why pricing is an important part of marketing pharmacy products and services. • Discuss how pricing relates to other elements of the marketing mix. • List and discuss the effects of consumer-related factors, competition, pharmacy objectives, and costs on pricing decisions. • Calculate the cost of providing a pharmacist service.
Learning Objectives (continued) • Explain the relationships among price, cost, and demand for a pharmacist service. • List and explain the steps involved in one strategy for pricing pharmacist services. • List and explain methods of presenting service prices to consumers.
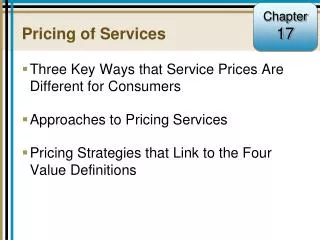
Components of price PRICE = INGREDIENT COST + SERVICE COST + PROFIT DISPENSING FEE
Measures of Rx ingredient cost AAC -- Actual acquisition cost AWP -- Average wholesale price (it’s really not) EAC -- Estimated acquisition cost MAC -- Maximum allowable cost -- multisource / generics AMP -- Average manufacturer’s price
Average per Rx profit • Based on required return on assets • Ex: $100,000 in Rx-related assets 12% required ROA 60,000 Rxs per year ROA = Net income / Assets NI = 12% x $100,000 = $12,000 NI / Rx = $12,000/ 60,000 = $0.20
Pricing • Focus on value – what is product or service worth to consumer • Value depends on • Consumer perceptions • How well service is provided • How convenient service is • How well benefits are explained • Value depends on all elements of marketing mix.
Pricing • Consider value to consumer • Set price to provide value • Cost affects pricing primarily as it affects value • Noncost factors equally important
Demand • Quantity that consumers will buy at a given price • Different from need • Can be affected by marketing mix • Is a function of price
Demand Curves inelastic elastic
Price Elasticity of Demand • % by which quantity demanded changes when there is a 1% change in price • Elastic – greater than 1% change in quantity • Inelastic – less than 1% change in quantity • Price elasticity of demand = consumer sensitivity to price
Consumers more sensitive to price when • Cost of product is large part of total cost • Minimal differences among products - Consumer can judge quality - Comparisons are easy to make • Switching costs are small
Competition • Prices must be in line • Distinct advantage • That consumer recognizes and values • Reference prices
Pharmacy Image • Price consistent with image • Consumers choose based on perceptions
Price as a Signal of Quality • High price = high quality • When hard to judge quality • When quality is variable and risk high
Pharmacy Goals • Maximize long-run profit • Increase sales or market share – penetration pricing • Increase sales of other products – loss leader pricing • Attract only customers willing to pay for better service – price skimming • Maintain status quo – match competitors’ prices
Nonmonetary Costs • Time costs • Search costs • Psychic costs
Demand Backward Pricing 3rd party payers cover 85+% of Rxs. 3rd party payers set prices. Pharmacy’s goal is to profitably provide services at given price.
Suggested Pricing Strategy • Estimate demand • Calculate full service cost (SC) • Determine avg. net income (NI) – consider goals • Set price = SC + avg. NI + product cost • Compare demand and price – re-evaluate if necessary • Consider competitors’ responses • Implement price • Monitor patient and competitor response • Re-evaluate price periodically
Estimated Demand for Diabetic Counseling Price Quantity Demanded $20 1,000 $25 750 $35 500 $45 250
Service Cost for Diabetic Counseling Volume Service Cost 1,000 $25 750 $33 500 $49 250 $98
Estimate Net Income • $15,000 in assets for DCC • Want a 12% ROA • $15,000 x 0.12 = $1,800 • Need $1,800 in annual profit to get 12% return • At volume of 500 sessions, average profit = 1,800/500 = $3.60 • Assumes goal of long-run profit
Set Price Volume SC Avg. NI PC Price 1,000 $25 1.80 0 $26.80 750 $33 2.40 0 $35.40 500 $49 3.60 0 $52.60 250 $98 7.20 0 105.20
Compare Volume Price Demand Assumed at that price 1,000 $26.80 < 750 750 $35.40 500 500 $52.60 < 250 250 105.20 << 250
Re-evaluate • Problem: prices will not generate enough demand • Solutions • Cut costs • Increase demand • Do not offer service
Pricing Strategy 1. Consider competitors’ responses – re-evaluate as needed 2. Implement price 3. Monitor patient and competitor response – re-evaluate as needed 4. Re-evaluate price periodically
Pricing Strategy • Set profit margins based on product demand • Focuses on consumer perceptions 1. Market priced – charge low margin - 10-25 Rxs / 30% volume 2. Staple – charge avg. margin - 75 Rx products / 25% volume 3. Premium – charge high margin - the rest of products
Pricing Strategy • Consistent with focus on ROA • ROA = NI/Sales x Sales/Assets • NI/Sales measures profit per unit • Sales/assets measures turnover or speed of sales • So, you increase return by ?