Download
1 / 29
340 likes | 637 Vues
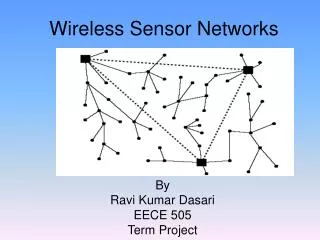
Networks: Gephi (and a little bit of Palladio). @ DJWrisley #RRSI2014, UTSC, May 2014. networks theory, analysis, visualization. Network analysis – a term encompassing a wide variety of practices with applications throughout (social) scientific and digital humanistic domains

E N D
Networks: Gephi (and a little bit of Palladio) @DJWrisley #RRSI2014, UTSC, May 2014
networks theory, analysis, visualization • Network analysis – a term encompassing a wide variety of practices with applications throughout (social) scientific and digital humanistic domains • “Network theory concerns itself with the study of graphs as a representation of either symmetric relations or, more generally, of asymmetric relations between discreteobjects.” (Wikipedia, 6 italicized words are mine—all debatable in humanist circles) • Network theory has its own conceptual vocabulary to express relationships between objects (e.g. betweenness, centrality, density, path length, modularity) – how can we interpret these analytical terms for humanities data?
network theory, analysis, visualization (2) • Social network analysis SNA looks at relationships between actors – what is the nature of interaction? • Latour adds objects in actor-network theory ANT – what could the relation of an actor and an object be? • Networks once drawn (drawn by Moretti- Network Theory, Plot Analysis), are now digitally created and manipulated • Powerful way of exploring multidimensional multi-scalar data (Brughmans)
@ElijahMeeks on the network • "The network is not a social network or geographic network or logical network but rather a primitive object capable of and useful for the modeling and analysis of relationships between a wide variety of objects." <https://dhs.stanford.edu/visualization/more-networks/>
Basic principles (1) • Not all study of networks is quantitative (Brughmans on Malkin, 2011), just as every mapping is not made of spatial data onto a map interface • Digital tools for network visualization and analysis use tabular data (quantification can be a challenge, metadata adds qualitative contours) • Digital tools like Gephi allow both for networks to be explored visually, and for static visuals of them to be exported. It does not allow for sharing. • Data visualization is a kind of “problem-posing”; we should avoid fetishizing the final visual. (McCosker/Wilke) – “diagrammatic” thinking
Basic Principles (2) • Tabular data used by network viz platforms are of two basic sorts • Nodes (discrete entities in a network, and any fixed metadata about them – gender, geospatial data) • Edges (specific instances of relations between nodes) NB: Gephi does generate a nodes table if it is missing (option: create missing nodes)
Network visualization tools • Gephi (standalone) • Elijah Meeks • https://dhs.stanford.edu/gephi-workshop/ • https://dhs.stanford.edu/visualization/more-networks/* • Non proprietary code – plug ins • Palladio (web-based) • NetXL • Sci² • Scott Weingart • Indiana MOOC on visualization • Points of comparison: performance, usability, filter, formats of data ownership, data portability, cost
Example 1 NB: Examples Increase in Scale
One textRamon Llull, Book of the Lover and the Beloved (late 13th) http://www.am.ub.edu/~jmiralda/llulltra.html
Llull Data Snapshot (@djwrisley @tracey_dh) nodes (left) edges (right)
Llull “social” networks, minus the narrator (@djwrisley @tracey_dh)
Algorithmic llull Fruchterman Force Atlas
14th c medieval french (around jean de meun) – stylometric analysis of 70+ textsJ Richards (Wuppertal – Germany)
Stylometric data sample • Open file RRSI stylo experiment
250+ Texts of medieval french – test case for power of stylometry given dialectal difference (@DJWrisley and J Richards) • Parts of gephi interface • Visualizing the network using the same file
Image: ORBIS: The Stanford Geospatial Network Model of the Roman World
A Brief Comparison - Gephi Palladio • standalone • open source • Established large user community = many plug-ins • Takes a while to learn • Science/humanities use • Not easy to share without giving away data • Network statistics • web-based • free • Relatively new • Learning curve low • Specifically for the humanities • simple to deal with data multi-dimensionality • Data is not kept • “without any barriers”
Palladio example – Space in Literature • Live Example using file “distorted VMP data”