Download

1 / 46
460 likes | 463 Vues
EVIDENCE AND DATA FOR LEADERS. WHAT IS IN THIS PRESENTATION. New ways to think about evidence A data use strategy Pre and post-testing Gathering evidence via rubrics Analysing data. NEW WAYS TO THINK ABOUT evidence. DEVELOPMENTAL vs STANDARD MODEL. Developmental model

E N D
WHAT IS IN THIS PRESENTATION • New ways to think about evidence • A data use strategy • Pre and post-testing • Gathering evidence via rubrics • Analysing data
DEVELOPMENTAL vs STANDARD MODEL Developmental model • Assessment is used to improve teaching • Teachers hold each other accountable based on their data and teaching strategies they use • Targeted teaching as much as possible – ideally individually but even 3-5 levels is usually sufficient • Compares students to criteria and focuses on where students are ready to learn • Developmental thinking: assessment tells me where a student is in their development and I teach them from there Standard model • Assessment occurs after instruction is complete • Teachers don’t question each others’ data or strategies • Teach whole class at once, with a bit of help for the lower kids and a bit of extension for the top kids if possible • Compares students to norms and focus on what students cannot do • Deficit thinking: students must be at a certain year level norm and I must correct all the deficits they have
A DATA PROCESS – PRE AND POST TESTING • pre and post test students • Analyse the data • Use the data to: • improve courses • improve teaching • identify teacher effectiveness
A DATA PROCESS – using data from existing assignments • get all teachers using skill-based rubrics • get them recording information on spreadsheets that they send to you • collate this information • analyse it to produce empirical progression • use progression to: • improve courses • improve teaching • help students track their own growth • show students what improvement looks like
Why pre and post-test? • We should be aiming to get a year’s worth of progress for a year’s worth of input • How do we measure a year’s worth of progress? • Effect size of 0.4 or more
What to pre and post-test? • historical skills • pick some from the curriculum • Our school has chosen four: • identifying cause and effect • using historical concepts • sequencing events • understanding historical perspectives
How to administer pre and post tests • By hand (painful) • Microsoft Forms • Google Docs + automatic scoring script like “Flubaroo”
WHY USE RUBRICS? Students: know how to get better Get higher quality feedback on their performance assessment data used as information rather than as judgement Parents: Know what their child can do, not how they compare Know the next thing their child is ready to learn Sees more motivated students – especially those at the top and at the bottom
WHY USE RUBRICS? Teachers: more consistent judgements between teachers (easier moderation) you don’t have to write as many comments more detailed information for reporting rewarding professional discussions between teachers promotes development: linked to skills not what is “normal” the teacher knows where a student is ready to learn can target teaching intervention to use with that student or group of students
WRITING QUALITY CRITERIA Advice Use student work samples to describe the levels Use learning taxonomies to help you come up with ideas e.g. Bloom’s, Dreyfus, Krathwohl, SOLO Good quality criteria should… no counts of things right/wrong or pseudo-counts (some, many) Avoid ambiguous terms like “appropriate”, “suitable” Describe increasing quality – no procedural steps Full guidelines: https://reliablerubrics.com/category/assessment-rubrics/what-is-a-rubric/guidelines/
3 GATHERING DATA USING A RUBRIC 3 3 3 3 2 2 2 2 2 1 1 1 1 1 2 1 1 1
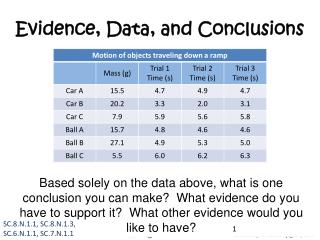
ANALYSING PRE AND POST TEST DATA • use unique student identifier (id number) • use excel function to rule out all students that didn’t do both the pre and the post test https://exceljet.net/formula/find-missing-values 3. calculate effect sizes for: • overall • teacher effect • year level effect https://vimeo.com/51258028
WHAT CAN YOU DO WITH THIS DATA? • Which skills are taught well? • Figure out how it was taught and replicate that elsewhere • Which skills are taught badly? • Is this because of how it is taught or its place in the course? • Which teachers taught well? • Figure out what they do that is transferrable and suggest others try that as well • Get other teachers to observe a teacher teaching a skill well • Film a teacher teaching a skill they teach well
ANALYSING ASSIGNMENT DATA • Combine year level cohort into one large spreadsheet and complete a Guttman analysis on it • via the attached “Guttman Boss”
ANALYSING ASSIGNMENT DATA • Combine year level cohort into one large spreadsheet and complete a Guttman analysis on it • via the attached “Guttman Boss” • Turn this into an empirically-derived learning progression
WHAT CAN YOU DO WITH THIS DATA? • Get students to track their own progress • Show students what improvement looks like • Target teaching of new skills at the right level • Design ability based groupings and teaching material
Start persuading people • pre and post-testing • online testing • using evidence to inform teaching • using assessment data formatively not just summatively • skill-based rubrics • writing decent quality criteria in rubrics • Using data
Pre and post-testing • measure just one thing? • begin with just one class / one year level / one subject? • see if other learning areas in your school do the same thing and learn off them? • Rubrics • begin with just one assignment / class / year level / subject? • Critique your existing ones by comparing them with ARC guidelines
Data use • Complete a empirical progression for one year level and show it off
advice • Staff buy-in is extremely important • Leverage early adopters to help persuade the rest • Use Dale Carnegie’s strategies: • Try honestly to see things from the other’s point of view • Let them feel it is their idea • Praise the slightest improvement • Give the other person a fine reputation to live up to
This presentation and associated files: https://lawlesslearning.com/free/evidencepd/ benlawless8@gmail.com “Assessment for Teaching” Patrick Griffin (editor)