Download
1 / 29
290 likes | 494 Vues
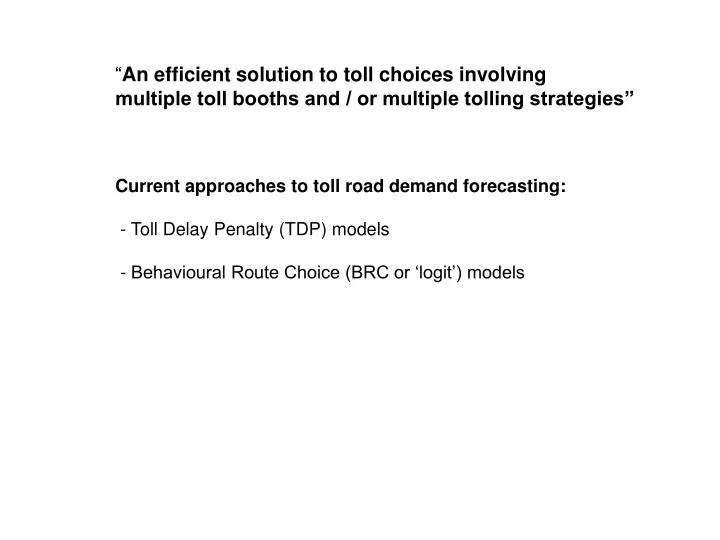
“ An efficient solution to toll choices involving multiple toll booths and / or multiple tolling strategies” Current approaches to toll road demand forecasting: - Toll Delay Penalty (TDP) models - Behavioural Route Choice (BRC or ‘logit’) models.

E N D
“An efficient solution to toll choices involving multiple toll booths and / or multiple tolling strategies”Current approaches to toll road demand forecasting: - Toll Delay Penalty (TDP) models - Behavioural Route Choice (BRC or ‘logit’) models
BEHAVIOURAL ROUTE CHOICE (BRC OR ‘LOGIT’) MODELS The payment of a toll is treated as a purchase of a range of road travel benefits The willingness of potential toll road users to pay a toll is driven by a range of relative utilities, with the value of time being only one component of choice.Pluses? Can be calibrated to observed toll road user behaviour (RPSP surveys) Minuses? Arbitrary definitions of potential toll users Complexity with multiple toll booths and/or multiple tolling strategies General convergence and run-time issues
UTILITIESUtility UN = a1 + a2 . Time_UNUtility A = a1 + a2 . Time_A + a3 . Toll_A Utility B = a1 + a2 . Time_B + a3 . Toll_B Utility AB = a1 + a2 . Time_AB + a3 . Toll_AB Utility BA = a1 + a2 . Time_BA + a3 . Toll_BA Calculating the tolls (A, B, AB, BA) is relatively easyCalculating the times (A, B, AB, BA) is messy and time-consuming (OD matrices) - network techniques such as toll link ‘flags’ or ‘switches’, select links etcHard enough with 4 toll segments – what about 300+ (Sydney since Westlink M7)
THE SYDNEY TOLL ROAD NETWORK - CURRENT TRENDS More toll booths Pre-M7 19 Post-M7 77More ‘valid’ toll segments Pre-M7 35 Post-M7 300+ (about half are M7 ramp-to-ramp) More ‘valid’ toll segments in the toll choice for each OD pair Pre-M7 2.0 (cutoff = 0 min) Post-M7 5.0 (cutoff = 0 min)
A NEW BRC APPROACH Potential toll segments For ‘n’ toll booths and up to three toll booths in a single trip, there are n + n2 + n3 toll segments eg for 10 toll booths, there are 1110 potential toll segmentsValid toll segments Logic test to remove obvious (eg AA, ABA, AAA, BAA) Input a list of valid toll segments User-defined toll connectivity matrix
A NEW BRC APPROACH A ‘dummy’ zone represents each toll booth Allows each OD variable (eg Travel time, StopStart time, Variability time, Reliability time) to be derived from a single matrix, for each valid toll segment, ‘on the fly’ or in memory The size of this single matrix is the number of centroids PLUS the number of toll booths Removes the need for toll ‘flags’ or toll ‘switches’ Uses standard matrix algebra for adding vectors and scalars The ‘dummy’ zone network construction (ie nodes and links) are easily integrated into a user’s existing transport software (eg EMME2, Voyager, TransCad etc).
A NEW BRC APPROACH A ‘dummy’ zone represents each toll booth
A NEW BRC APPROACH Untolled OD times Tolled OD times (Toll segments A, B, AB, BA) Define toll catchments by comparing untolled and tolled times eg For toll segment A, accept an OD if Tolled time_A – ‘Cutoff’ – Untolled time < 0 etc Toll segments are SPARSE – why process tolled ODs that fail? [Public transport matrices are also generally sparse eg Bus-Rail] Don’t need to build toll segments using toll ‘flags’ or ‘switches’ Matrix-based rather than network-based Depending on the ‘Cutoff’ Catchment ODs increase or decrease Toll segment BA may fail for the example OD
A NEW BRC APPROACH Toll segments are SPARSE The Sydney demand matrix has 1,000,000 (1000 zones) or 8M The largest of the 300+ toll segments is only 12% Remaining toll segments from 1-12% The new BRC model uses sophisticated matrix indexing to ensure that only the valid OD pairs of each valid toll segment are processed, whilst retaining full matrix functionality. The process is undertaken wholly in memory and is limited only by available computer memory (1.5G), easily sufficient for 300+ toll segments and two toll classes (say car and truck)
A NEW BRC APPROACH Trip threshold The use of a trip threshold after the first model iteration can significantly reduce the number of toll segments to be considered in later iterations, by skipping those toll segments where the total tolled trips (summed across all toll classes) are less than the specified trip threshold. Number of toll segments versus model run-time
A NEW BRC APPROACH Preparing a single demand matrix for assignment Disaggregate the tolled trips into component ‘legs’ Sum across all toll segments Add the untolled demands Sum across all toll classes Ensures that a computationally efficient single-class equilibrium assignment can be performed (all link tolls banned). The model converges readily because ALL the tolled trips must travel through their designated toll booths (or at least through the adjacent dummy zone) For reporting and/or analysis purposes, multi-class assignments can still be undertaken eg untolled/tolled
A NEW BRC APPROACH (FASTOLL) Preparing a single demand matrix for assignment
A NEW BRC APPROACH (FASTOLL) Summary of key features: BRC models – convergence, runtimes, arbitrary definitions Valid toll segments (logic, list and/or toll connectivity matrix) Each toll booth is represented by a ‘dummy’ zone. For each toll segment, travel times can be extracted from a single matrix ‘on the fly’ An acceptance condition (ie cutoff) defines, for each valid toll segment, the valid OD pairs (the cutoff equals amount of negative time savings) – toll segment ODs are SPARSE Sophisticated matrix indexing is used to ensure only valid ODs are processed in memory, whilst retaining full matrix functionality Trip threshold to skip minor toll segments – saves runtime Disaggregating tolled trips into component ‘legs’, summing across all toll segments and adding untolled trips, ensures that a computationally efficient single class equilibrium assignment can be performed.
FASTOLL - a new BRC approach Toll demand forecasting module Integrates seamlessly with user’s existing software (EMME2, Voyager, TransCad). Existing software used for equilibrium assignment only Spreadsheet-based inputs Implemented as an Application Program in MaxMan (MAtriX MANager) Demonstration available