Download
1 / 12
160 likes | 304 Vues
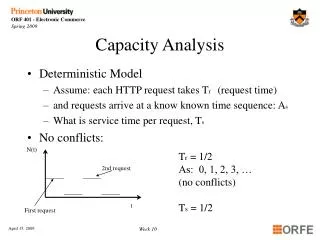
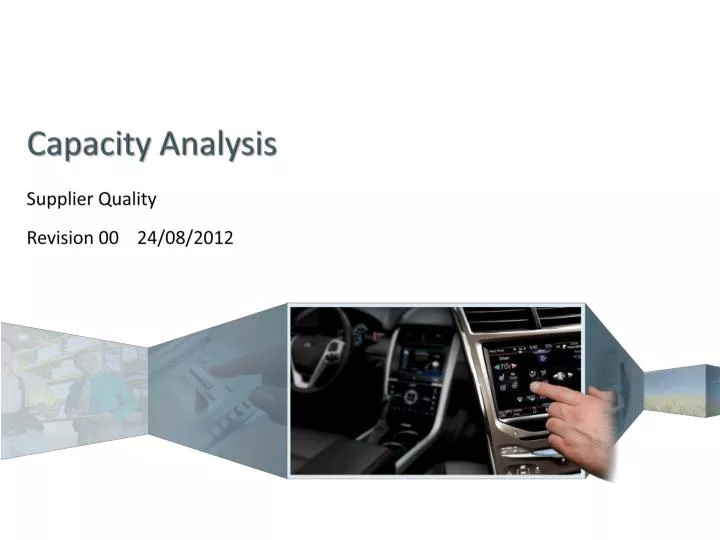
Capacity Analysis Supplier Quality Revision 00 24/08/2012. Capacity Analysis. Fill in Supplier Name and Supplier Location (Address) . Fill in Part Name (Ex: Bush, Button, Housing…….refer to drawing) .

E N D
Capacity Analysis Supplier Quality Revision 00 24/08/2012
Capacity Analysis • Fill in Supplier Name and Supplier Location (Address) • Fill in Part Name (Ex: Bush, Button, Housing…….refer to drawing) • Fill in Part Number (If the study is on a group of parts no. of parts together list all part nos.) • Fill in Date when Capacity Analysis Exercise was conducted • APW stands for Average Production Weekly. This is the average weekly quantity of parts specified by Methode. This means that if requirements are 2,000 per week in the first month and 4,000 per week when production peaks, the APW shall be 3,000. • MPW stands for Maximum Production Weekly. This is the maximum no. of parts/ week specified by Methode.
Capacity Analysis • Fill in Supplier Contact person details • Sheet shall be tackled taking one process at a time. • That is if supplied part is a laser etched painted plastic button, there are three processes which are plastic injection moulding, painting and laser etching. • If a part is machined and then plated, a typical process shall be blanking, polish of drawn material outer profile, drilling, roughing, internal diameter of one side (roughing and finishing), Outer finishing, second side internal and external diameters, plating and 100% check.
Capacity Analysis • Fill in Process Name • How many days per week is the process running? • How many shifts is the process doing per day? • How long is the shift (in hours)? Example if shift starts at 6.00 and ends at 14.00, duration is 8 hours. • What amount of time is the process stopped for breaks, preventive maintenance, cleaning, handover, lunch, etc. (PER SHIFT)? Time should be in minutes. If machine is not stopped during break/ lunch, then the break/ lunch time shall not be considered in this calculation. • Is the process used only on the product on which the capacity analysis is being carried out? If yes input 100%. If the process is shared with other products please enter the percentage allocated for this product. Example: if besides this product, there are another 6 products that are taking 20 hours of a 24 day, then time available for this product is 4 hrs out of 24hrs which results in 16.6%.
Capacity Analysis • If the process is shared with other components then there should be a changeover time in the highlighted field. Changeover is the time needed (in minutes) to switch off from process A and switch on process B. This could include material change, tool change, cutter change, etc. – depending on the process. If changeover time is inconsistent, take worst case scenario. Example if changeover time on process A is 15 minutes and change over time on process B is 30 minutes – take 30 minutes into equation. • How many changeovers are carried out per week? The number of changeovers may vary from week to week. In such case please take the maximum. Keep in mind that the scope of the capacity analysis is to understand if with current process and existing equipment, the supplier is able to supply enough components as requested by the customer.
Capacity Analysis • From experience, how much parts are rejected during this process?
Capacity Analysis • What is the ideal cycle time (in seconds) for this process? If the capacity analysis is preliminary (theoretical), please calculate this time from your experience. • How many tools are available – doing the same process? In case of machining, how many machines can be used to produce similar parts at the same time? • How many parts are produced in one cycle (in the cycle time period specified above)? For example, if the process in question is injection moulding from a four cavity tool, then the value to insert in the table above shall be 4. • Unless approved by Methode, rework is not acceptable. However if this is the case, input the no. of parts that are recuperated from rejects by re-working. • Include any remarks that will help the receiver to understand if something is not clear.
Capacity Analysis • This is the second part of the study – Section B – which is looking at actual facts. Supplier is requested to carry out a production representative run. Duration of run depends on the product and is to be discussed case by case between Methode and Supplier. • How long is the run in minutes? If there is a changeover planned during OEE run DO NOT deduct the changeover time. Example if run starts at 10.00 and stops at 14.00, the value to be input in highlighted field is 360minutes (6hrs x 60 minutes). Some customers specifically ask for a changeover to be inserted in the OEE – this shall be discussed with Methode. • Was the process stopped for breaks, meetings or any planned activity? If yes, please include the no. of minutes in which the process was stopped. If process was working during an operator break, this is not considered as planned downtime…..as the process was not stopped.
Capacity Analysis • If there was a change over planned in the run please insert the actual time (in minutes) taken for the changeover to take place. It is important that the change over activity is given the same importance as a normal changeover during production. If during production, there are two persons changing a tool, then during this run, the same two persons shall be do the job. • Collect any unplanned downtime that takes place during the run and insert this in the highlighted field. This may include breakdown maintenance, power cuts, quality issues that need intervention on process, etc.
Capacity Analysis • Insert the total no. of parts produced during the run. Include both good, and bad quality parts. • Insert the total no. of parts that were detected as not in order and were scrapped. • Insert the total no. of parts that were detected as not in order but these were reworked and can now be used for production. • Insert the actual cycle time (seconds) taken for one cycle. If it is recorded on the machine, the average of a sample of readings taken through out the production run can be inserted in the highlighted area. If this is not recorded automatically, the cycle time shall be taken by the use of a stop watch. In this case one has to measure timing every half an hour and take the average reading.
Capacity Analysis – Result Area • Section C is giving a picture of the capacity study. • Highlighted fields show if the actual OEE is good enough to fulfil customer Average and Maximum requirements. If field is marked as OK, the result is satisfactory and no actions are needed. If field is marked as RISK, then actions need to be taken on that particular process. Actions may vary from processing parameters, addition of new machines, increasing the no. of operators, etc. – depending on the process. Whatever the actions taken, these shall be communicated to the customer in writing together with target dates. Once actions are in place, capacity analysis shall be repeated. • The results are also pictured in a graph that demonstrates the actual gaps where action is needed.
If in doubt, please ask Methode Supplier Quality for assistance.