Download
1 / 56
560 likes | 988 Vues
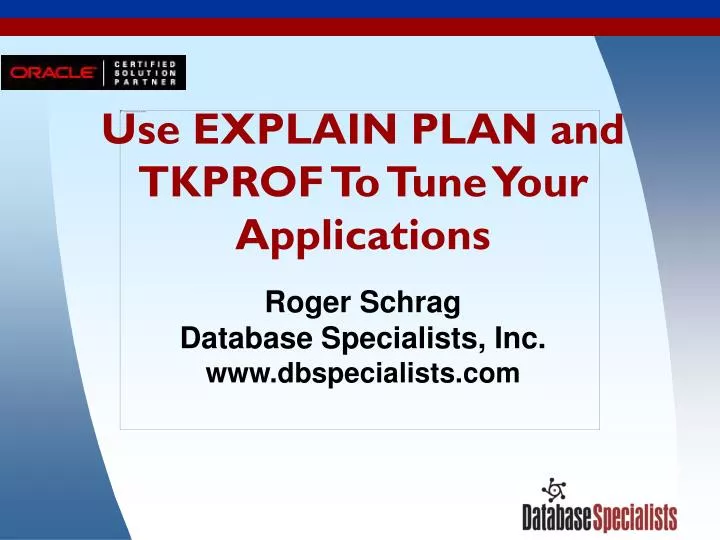
Use EXPLAIN PLAN and TKPROF To Tune Your Applications. Roger Schrag Database Specialists, Inc. www.dbspecialists.com. Today’s Session. EXPLAIN PLAN overview TKPROF overview Why??? Reading execution plans Reading TKPROF reports. White Paper.

E N D
Use EXPLAIN PLAN and TKPROF To Tune Your Applications Roger Schrag Database Specialists, Inc. www.dbspecialists.com
Today’s Session • EXPLAIN PLAN overview • TKPROF overview • Why??? • Reading execution plans • Reading TKPROF reports
White Paper • Twenty one pages of details I can't possibly cover in a one hour presentation! • Lots of sample code, execution plans, and TKPROF reports that you will see are probably not readable when I put them up on PowerPoint slides—but they are readable in the white paper. • Download: www.dbspecialists.com/presentations
Execution Plans and EXPLAIN PLAN • An execution planis a list of steps that Oracle will follow in order to execute a SQL statement. Each step is one of a finite number of basic operations known to the database server. Even the most complex SQL statement can be broken down into a series of basic operations. • EXPLAIN PLANis a statement that allows you to have Oracle generate the execution plan for any SQL statement without actually executing it. You will be able to examine the execution plan by querying the plan table.
The Plan Table • Aplan tableholds execution plans generated by the EXPLAIN PLAN statement. • The typical name for a plan table is plan_table, but you may use any name you wish. • Create the plan table by running utlxplan.sql, located in $ORACLE_HOME/rdbms/admin.
Important Columns in the Plan Table statement_id Unique identifier for each execution plan timestamp When the execution plan was generated operation The operation performed in one step of the execution plan, such as “table access” options Additional information about the operation, such as “by index ROWID” object_name Name of table, index, view, etc. accessed optimizer Optimizer goal used when creating execution plan id Step number in execution plan parent_id Step number of parent step
EXPLAIN PLAN Prerequisites • INSERT privilege on a plan table • All necessary privileges to execute the statement being explained • SELECT privileges on underlying tables of views, if the statement being explained involves views
EXPLAIN PLAN Syntax EXPLAIN PLAN [SET STATEMENT_ID = <string in single quotes>] [INTO <plan table name>] FOR <SQL statement>;
Querying an Execution Plan from the Plan Table • Use a CONNECT BY clause to trace the hierarchy • Use LPAD function to indent rows, making the hierarchy easier to follow • Put statement_id in WHERE clause to retrieve only one execution plan at a time • Sample script on next slide shows the most important information • You can also try utlxpls.sql or utlxplp.sql in $ORACLE_HOME/rdbms/admin
A Simple Query to Display Execution Plans SET VERIFY OFF ACCEPT stmt_id CHAR PROMPT "Enter statement_id: " COL id FORMAT 999 COL parent_id FORMAT 999 HEADING "PARENT" COL operation FORMAT a35 TRUNCATE COL object_name FORMAT a30 SELECT id, parent_id, LPAD (' ', LEVEL - 1) || operation || ' ' || options operation, object_name FROM plan_table WHERE statement_id = '&stmt_id' START WITH id = 0 AND statement_id = '&stmt_id' CONNECT BY PRIOR id = parent_id AND statement_id = '&stmt_id';
A Sample Execution Plan SQL> EXPLAIN PLAN SET statement_id = 'demo' FOR 2 SELECT a.customer_name, a.customer_number, b.invoice_number, 3 b.invoice_type, b.invoice_date, b.total_amount, 4 c.line_number, c.part_number, c.quantity, c.unit_cost 5 FROM customers a, invoices b, invoice_items c 6 WHERE c.invoice_id = :b1 7 AND c.line_number = :b2 8 AND b.invoice_id = c.invoice_id 9 AND a.customer_id = b.customer_id; Explained. SQL> @explain.sql Enter statement_id: demo ID PARENT OPERATION OBJECT_NAME ---- ------ ----------------------------------- ----------------- 0 SELECT STATEMENT 1 0 NESTED LOOPS 2 1 NESTED LOOPS 3 2 TABLE ACCESS BY INDEX ROWID INVOICE_ITEMS 4 3 INDEX UNIQUE SCAN INVOICE_ITEMS_PK 5 2 TABLE ACCESS BY INDEX ROWID INVOICES 6 5 INDEX UNIQUE SCAN INVOICES_PK 7 1 TABLE ACCESS BY INDEX ROWID CUSTOMERS 8 7 INDEX UNIQUE SCAN CUSTOMERS_PK
Other Ways to View Execution Plans • The autotrace feature in SQL*Plus • Performance tuning tools Check out TOAD from Quest Software at: http://www.toadsoft.com/downld.html SET AUTOTRACE OFF|ON|TRACEONLY [EXPLAIN] [STATISTICS]
Sample Autotrace Output in SQL*Plus Execution Plan ---------------------------------------------------------- 0 SELECT STATEMENT Optimizer=CHOOSE (Cost=4 Card=1 Bytes=39) 1 0 NESTED LOOPS (Cost=4 Card=1 Bytes=39) 2 1 NESTED LOOPS (Cost=3 Card=1 Bytes=27) 3 2 TABLE ACCESS (BY INDEX ROWID) OF 'INVOICE_ITEMS' (Cost =2 Card=1 Bytes=15) 4 3 INDEX (UNIQUE SCAN) OF 'INVOICE_ITEMS_PK' (UNIQUE) ( Cost=1 Card=2) 5 2 TABLE ACCESS (BY INDEX ROWID) OF 'INVOICES' (Cost=1 Ca rd=2 Bytes=24) 6 5 INDEX (UNIQUE SCAN) OF 'INVOICES_PK' (UNIQUE) 7 1 TABLE ACCESS (BY INDEX ROWID) OF 'CUSTOMERS' (Cost=1 Car d=100 Bytes=1200) 8 7 INDEX (UNIQUE SCAN) OF 'CUSTOMERS_PK' (UNIQUE)
EXPLAIN PLAN Limitations • The EXPLAIN PLAN statement provides a good faith estimate of the execution plan that Oracle would use. The real plan that gets used may differ from what EXPLAIN PLAN tells you for many reasons: • Optimizer stats, cursor sharing,, bind variable peeking, dynamic instance parameters make plans less stable. • EXPLAIN PLAN does not peek at bind variables. • EXPLAIN PLAN does not check the library cache to see if the statement has already been parsed. • EXPLAIN PLAN does not work for some queries: ORA-22905: cannot access rows from a non-nested table item
Viewing Actual Execution Plans • The v$sql view shows statements in the library cache. Here you can find the address, hash value, and child number for a statement of interest. • The v$sql_plan view shows the actual execution plan for each statement, given its address, hash value, and child number. The columns are similar to the plan table. • The v$sql_plan_statistics view shows actual statistics (rows, buffer gets, elapsed time, etc.) for each operation of the execution plan. • The v$sql_plan and v$sql_plan_statistics views are available starting in Oracle 9i. v$sql_plan_statistics is not populated by default.
A Simple Query to Display Actual Execution Plans SET VERIFY OFF COL id FORMAT 999 COL parent_id FORMAT 999 HEADING "PARENT" COL operation FORMAT a35 TRUNCATE COL object_name FORMAT a30 SELECT id, parent_id, LPAD (' ', LEVEL - 1) || operation || ' ' || options operation, object_name FROM ( SELECT id, parent_id, operation, options, object_name FROM v$sql_plan WHERE address = '&address' AND hash_value = &hash_value AND child_number = &child_number ) START WITH id = 0 CONNECT BY PRIOR id = parent_id;
Trace Files and TKPROF • The Oracle server process managing a database session writes a verbosetrace filewhen SQL trace is enabled for the session. • TKPROFis a utility provided by Oracle that formats SQL trace files into very helpful and readable reports. TKPROF is installed automatically when the database server software is installed. You invoke TKPROF from the operating system command line; there is no graphical interface for TKPROF. Starting in Oracle 9i TKPROF can read extended SQL trace files and report on wait events statistics.
Enabling SQL Trace • At the instance level: • sql_trace = true • timed_statistics = true(optional) • In your own session: • ALTER SESSION SET sql_trace = TRUE; • ALTER SESSION SET timed_statistics = TRUE;(optional) • In another session: • SYS.dbms_system.set_sql_trace_in_session • (<SID>, <serial#>, TRUE)
Look in the user dump destination. On OFA compliant systems this will be$ORACLE_BASE/admin/$ORACLE_SID/udump Check timestamps and file contents to see which trace file is yours If non-DBAs need access to trace files, add_trace_files_public = trueto theparameter file to avoid permissions problems on Unix platforms Use a dedicated server connection when tracing, if possible. Finding the Trace File
Formatting a Trace File with TKPROF Invoke TKPROF from the operating system prompt like this: tkprof <trace file> <output file> \ [explain=<username/password>] \ [sys=n] [sort=<keyword>]
TKPROF Command-line Arguments tkprof <trace file> <output file> \ [explain=<username/password>] \ [sys=n] [sort=<keyword>] trace file The SQL trace file to be formatted output file The formatted output to be written by TKPROF explain= Database login to be used if you want the output to include execution plans sys=n Omit “recursive SQL” performed by the SYS user sort= List traced SQL statement in the output file in a specific order
TKPROF Sample Output SELECT a.customer_name, a.customer_number, b.invoice_number, b.invoice_type, b.invoice_date, b.total_amount, c.line_number, c.part_number, c.quantity, c.unit_cost FROM customers a, invoices b, invoice_items c WHERE c.invoice_id = :b1 AND c.line_number = :b2 AND b.invoice_id = c.invoice_id AND a.customer_id = b.customer_id call count cpu elapsed disk query current rows ------- ------ -------- ---------- ---------- ---------- ---------- ---------- Parse 1 0.05 0.02 0 0 0 0 Execute 1 0.00 0.00 0 0 0 0 Fetch 2 0.00 0.00 8 8 0 1 ------- ------ -------- ---------- ---------- ---------- ---------- ---------- total 4 0.05 0.02 8 8 0 1 Misses in library cache during parse: 1 Optimizer goal: CHOOSE Parsing user id: 34 (RSCHRAG)
Why Look at Execution Plans and TKPROF Reports? These tools are critical to the application tuning process, and tuning at the application level is necessary for high performance systems. With EXPLAIN PLAN, v$sql_plan, and TKPROF, you can: • Proactively tune applications that are in development • Reactively tune production systems that are experiencing performance problems • Estimate resource needs or feasibility of ad-hoc queries • Quantify resource needs for specific applications
Reading Execution Plans An execution plan is a hierarchical listing of steps. Each step is one of a few basic data access operations known to the database server. The most complex SQL statement can be broken down into a series of basic operations. • “Read from the most indented step outward.” This is not exactly correct! • Instead, take this approach: a) Start at the least indented step b) Find the step or steps that provide direct input to the step noted in (a). c) Evaluate each of the steps found in (b). This may involve recursively finding steps that provide input and evaluating them.
Execution Plan Example #1 SELECT customer_id, customer_name FROM customers WHERE UPPER (customer_name) LIKE 'ACME%' ORDER BY customer_name; OPERATION OBJECT_NAME ------------------------------ -------------- SELECT STATEMENT SORT ORDER BY TABLE ACCESS FULL CUSTOMERS
Execution Plan Operations TABLE ACCESS FULL Perform a full table scan of the indicated table and retrieve all rows that meet criteria from the WHERE clause.Input:no subordinate operations.Output:the necessary columns from the rows meeting all criteria. SORT ORDER BY Sort the input rows for the purpose of satisfying an ORDER BY clause.Input:the rows to be sorted.Output:the rows in sorted order.
Execution Plan Example #2 SELECT a.customer_name, b.invoice_number, b.invoice_date FROM customers a, invoices b WHERE b.invoice_date > TRUNC (SYSDATE - 1) AND a.customer_id = b.customer_id; OPERATION OBJECT_NAME ------------------------------ -------------- SELECT STATEMENT NESTED LOOPS TABLE ACCESS BY INDEX ROWID INVOICES INDEX RANGE SCAN INVOICES_DATE TABLE ACCESS BY INDEX ROWID CUSTOMERS INDEX UNIQUE SCAN CUSTOMERS_PK
Execution Plan Operations INDEX UNIQUE SCAN Look up a complete key in a unique index.Input: usually no subordinate operations. (Key values typically come from the original query or a parent operation.)Output:zero or one ROWIDs from the index. INDEX RANGE SCAN Look up a key in a non-unique index, or an incomplete key in a unique index.Input: usually no subordinate operations.Output:zero or more ROWIDs from the index.
Execution Plan Operations TABLE ACCESS BY INDEX ROWID Look up rows in a table by their ROWIDs.Input:a list of ROWIDs to look up.Output:the necessary columns from the rows with the given ROWIDs. NESTED LOOPS Perform a join between two sets of row data using the nested loops algorithm.Inputs:two separate sets of row data.Output:the results of the join. For each row Oracle reads from the first input, the operations that make up the second input are executed once and matching rows generate output.
Execution Plan Example #3 SELECT a.customer_name, COUNT (DISTINCT b.invoice_id) open_invs, COUNT (c.invoice_id) open_inv_items FROM customers a, invoices b, invoice_items c WHERE b.invoice_status = 'OPEN' AND a.customer_id = b.customer_id AND c.invoice_id (+) = b.invoice_id GROUP BY a.customer_name; OPERATION OBJECT_NAME -------------------------------- ---------------- SELECT STATEMENT SORT GROUP BY NESTED LOOPS OUTER HASH JOIN TABLE ACCESS BY INDEX ROWID INVOICES INDEX RANGE SCAN INVOICES_STATUS TABLE ACCESS FULL CUSTOMERS INDEX RANGE SCAN INVOICE_ITEMS_PK
Execution Plan Operations HASH JOIN Perform a join between two sets of row data using the hash join algorithm.Inputs:two separate sets of row data.Output:the results of the join. Oracle reads all rows from the second input and builds a hash structure, before reading each row from the first input one at a time. For each row from the first input, the hash structure is probed and matching rows generate output.
Execution Plan Operations NESTED LOOPS OUTER Same as the NESTED LOOPS operation, except that an outer join is performed. SORT GROUP BY Same as the SORT ORDER BY operation, except that the rows are sorted and grouped to satisfy a GROUP BY clause.
Execution Plan Example #4 SELECT customer_name FROM customers a WHERE EXISTS (SELECT 1 FROM invoices_view b WHERE b.customer_id = a.customer_id AND number_of_lines > 100) ORDER BY customer_name; CREATE OR REPLACE VIEW invoices_view AS SELECT a.invoice_id, a.customer_id, COUNT(*) number_of_lines FROM invoices a, invoice_items b WHERE b.invoice_id = a.invoice_id GROUP BY a.invoice_id, a.customer_id;
Execution Plan Example #4(continued) OPERATION OBJECT_NAME ----------------------------------- ------------- SELECT STATEMENT SORT ORDER BY FILTER TABLE ACCESS FULL CUSTOMERS VIEW INVOICES_VIEW FILTER SORT GROUP BY NESTED LOOPS TABLE ACCESS BY INDEX ROWID INVOICES INDEX RANGE SCAN INVS_CUST_ID INDEX RANGE SCAN INV_ITEMS_PK
Execution Plan Operations FILTER Read a set of row data and discard some rows based on various criteria. To determine the criteria, operations from a second input may need to be performed.Input:rows to be examined and, sometimes, an additional subordinate operation that must be performed for each row from the first input in order to evaluate criteria.Output:the rows from the first input that met the criteria.
Execution Plan Operations VIEW Build a physical representation of a database view or subset of a database view. Input:set of row data.Output:set of row data that implements the view or subset of the view.
Notes on Execution Plan Operations • The optimizer rewrites subqueries as joins and merges them into the main query whenever possible. • If a subquery is completely independent of the main query and cannot be merged into the main query, the optimizer may treat the subquery as a separate statement and leave it out of the execution plan for the main query. • The optimizer expands view definitions and merges them into the main query wherever possible. A VIEW operation will only appear in an execution plan when the view definition could not be merged.
Execution Plan Example #5 SELECT /*+ RULE */ a.cust_name, b.contact_name FROM customers a, contacts@sales.acme.com b WHERE UPPER(b.contact_name) = UPPER(a.cust_name); Execution Plan ------------------------------------------------ 0 SELECT STATEMENT Optimizer=HINT: RULE 1 0 MERGE JOIN 2 1 SORT (JOIN) 3 2 REMOTE* SALES.ACME.COM 4 1 SORT (JOIN) 5 4 TABLE ACCESS (FULL) OF 'CUSTOMERS' 3 SERIAL_FROM_REMOTE SELECT "CONTACT_NAME" FROM "CONTACTS" "B”
Execution Plan Operations REMOTE Submit a SQL statement to a remote database via Oracle Net.Input:typically no subordinate operations.Output:the results of the query from the remote database. Note that the database link used to access the remote database and the actual SQL submitted to the remote database will be accessible from the execution plan.
Execution Plan Operations SORT JOIN Same as the SORT GROUP BY operation, except that the input is sorted by the join column or columns in preparation for a join using the merge join algorithm.
Execution Plan Operations MERGE JOIN Perform a join between two sets of row data using the merge join algorithm.Inputs:two separate sets of row data.Output:the results of the join. Oracle reads rows from both inputs in an alternating fashion and merges together matching rows in order to generate output. The two inputs are assumed to be sorted on the join column or columns.
Summary of Operations We have not covered all of the execution plan operations, but we have covered some of the most common ones: • TABLE ACCESS FULL • TABLE ACCESS BY INDEX ROWID • INDEX UNIQUE SCAN • INDEX RANGE SCAN • NESTED LOOPS • NESTED LOOPS OUTER • HASH JOIN • MERGE JOIN • FILTER • VIEW • REMOTE • SORT ORDER BY • SORT GROUP BY • SORT JOIN
Elements of a TKPROF Report • Report heading • TKPROF version, date run, sort option, trace file • One entry for each distinct SQL statement in trace file • Listing of SQL statement • OCI call statistics: count of parse, execute, and fetch calls, rows processed, and time and I/O used • Parse information: parsing user, recursive depth, library cache misses, and optimizer mode • Row source operation listing • Execution plan listing (optional) • Wait event listing (optional)
Elements of a TKPROF Report(continued) • Report Summary • OCI call statistics totals • Counts of how many statements were found in the trace file, how many were distinct, and how many were explained in the report.
Sample TKPROF Report Heading TKPROF: Release 8.1.6.1.0 - Production on Wed Aug 9 19:06:36 2000 (c) Copyright 1999 Oracle Corporation. All rights reserved. Trace file: example.trc Sort options: default ************************************************************************ count = number of times OCI procedure was executed cpu = cpu time in seconds executing elapsed = elapsed time in seconds executing disk = number of physical reads of buffers from disk query = number of buffers gotten for consistent read current = number of buffers gotten in current mode (usually for update) rows = number of rows processed by the fetch or execute call
Sample OCI Call Statistics SELECT table_name FROM user_tables ORDER BY table_name call count cpu elapsed disk query current rows ------- ------ -------- ---------- --------- --------- --------- --------- Parse 1 0.01 0.02 0 0 0 0 Execute 1 0.00 0.00 0 0 0 0 Fetch 14 0.59 0.99 0 33633 0 194 ------- ------ -------- ---------- --------- --------- --------- --------- total 16 0.60 1.01 0 33633 0 194 Misses in library cache during parse: 1 Optimizer goal: CHOOSE Parsing user id: RSCHRAG [recursive depth: 0]
What the TKPROF Sample on the Previous Slide Tells Us • The application called on Oracle to parse this statement once while SQL trace was enabled. • The parse took 0.01 CPU seconds, 0.02 elapsed seconds. • No disk I/Os or buffer gets took place during the parse, suggesting that no misses in the dictionary cache. • Oracle was called on to execute this statement once. • The execution took under 0.01 CPU seconds. • No disk I/Os or buffer gets took place during the execution. (Queries often defer the work to the fetch phase.) • Oracle was called on 14 times to perform a fetch, and a total of 194 rows were returned.
What the TKPROF Sample Tells Us (continued) • Fetching took 0.59 CPU seconds, 0.99 elapsed seconds. • Fetching required 33,633 buffer gets in consistent mode, but no physical reads were required. • The statement was not in the library cache (shared pool) when the parse call came in. • The cost-based optimizer and a goal of “choose” were used to parse the statement. • The RSCHRAG user was connected to the database when the parse occurred. • This statement was executed directly by the application; it was not invoked recursively by the SYS user or a database trigger.
Sample Row Source Operation Listing Rows Row Source Operation ------- --------------------------------------------------- 194 SORT ORDER BY 194 NESTED LOOPS 195 NESTED LOOPS OUTER 195 NESTED LOOPS OUTER 195 NESTED LOOPS 11146 TABLE ACCESS BY INDEX ROWID OBJ$ 11146 INDEX RANGE SCAN (object id 34) 11339 TABLE ACCESS CLUSTER TAB$ 12665 INDEX UNIQUE SCAN (object id 3) 33 INDEX UNIQUE SCAN (object id 33) 193 TABLE ACCESS CLUSTER SEG$ 387 INDEX UNIQUE SCAN (object id 9) 194 TABLE ACCESS CLUSTER TS$ 388 INDEX UNIQUE SCAN (object id 7)