Download
1 / 47
470 likes | 476 Vues
Explore the concept of learning from observations using decision trees and information gain to determine the most useful attributes for discriminating between classes.

E N D
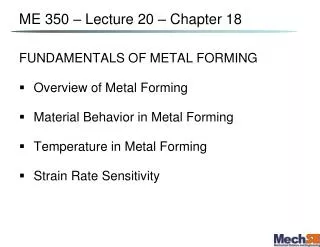
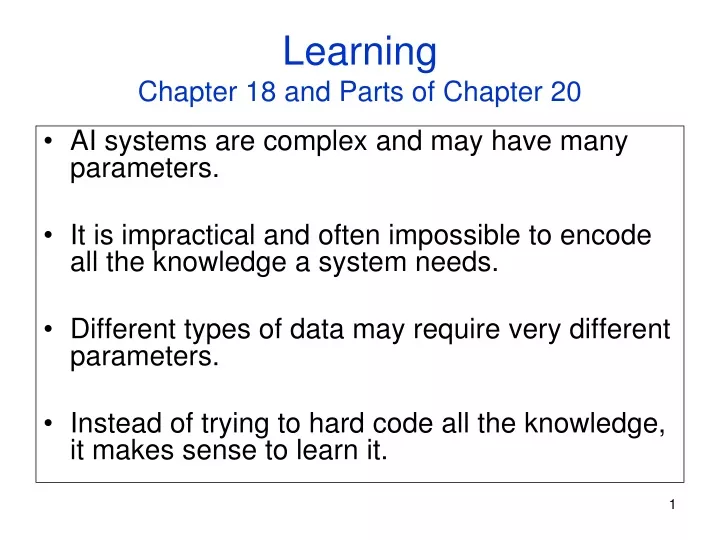
LearningChapter 18 and Parts of Chapter 20 • AI systems are complex and may have many parameters. • It is impractical and often impossible to encode all the knowledge a system needs. • Different types of data may require very different parameters. • Instead of trying to hard code all the knowledge, it makes sense to learn it.
Learning from Observations • Supervised Learning – learn a function from a set of training examples which are preclassifiedfeature vectors. feature vector class (shape,color) (square, red) I (square, blue) I (circle, red) II (circle blue) II (triangle, red) I (triangle, green) I (ellipse, blue) II (ellipse, red) II Given a previously unseen feature vector, what is the rule that tells us if it is in class I or class II? (circle, green) ? (triangle, blue) ?
Learning from Observations • Unsupervised Learning – No classes are given. The idea is to find patterns in the data. This generally involves clustering. • Reinforcement Learning – learn from feedback after a decision is made.
Topics to Cover • Inductive Learning • decision trees • ensembles • neural nets • kernel machines • Unsupervised Learning • K-Means Clustering • Expectation Maximization (EM) algorithm
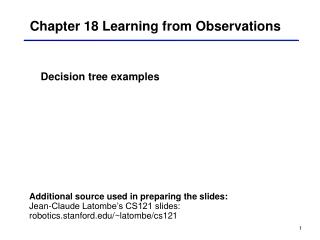
Decision Trees • Theory is well-understood. • Often used in pattern recognition problems. • Has the nice property that you can easily understand the decision rule it has learned.
How do we choose the best attribute? What should that attribute do for us?
Shall I play tennis today?Which attribute should be selected? “training data” witten&eibe
Criterion for attribute selection • Which is the best attribute? • The one that will result in the smallest tree • Heuristic: choose the attribute that produces the “purest” nodes • Need a good measure of purity! • Maximal when? • Minimal when?
Unemployed Employed Less or equal 50K Over 50K Information Gain Which test is more informative? Split over whether applicant is employed Split over whether Balance exceeds 50K
Information Gain Impurity/Entropy (informal) • Measures the level of impurity in a group of examples
Impurity Very impure group Less impure Minimum impurity
Entropy: a common way to measure impurity • Entropy = pi is the probability of class i Compute it as the proportion of class i in the set. • Entropy comes from information theory. The higher the entropy the more the information content. 16/30 are green circles; 14/30 are pink crosses log2(16/30) = -.9; log2(14/30) = -1.1 Entropy = -(16/30)(-.9) –(14/30)(-1.1) = .99 What does that mean for learning from examples?
2-Class Cases: Minimum impurity • What is the entropy of a group in which all examples belong to the same class? • entropy = - 1 log21 = 0 • What is the entropy of a group with 50% in either class? • entropy = -0.5 log20.5 – 0.5 log20.5 =1 not a good training set for learning Maximum impurity good training set for learning
Information Gain • We want to determine which attribute in a given set of training feature vectors is most useful for discriminating between the classes to be learned. • Information gain tells us how important a given attribute of the feature vectors is. • We will use it to decide the ordering of attributes in the nodes of a decision tree.
Calculating Information Gain Information Gain = entropy(parent) – [average entropy(children)] child entropy parent entropy Entire population (30 instances) 17 instances child entropy (Weighted) Average Entropy of Children = 13 instances Information Gain= 0.996 - 0.615 = 0.38 for this split
Entropy-Based Automatic Decision Tree Construction Node 1 What feature should be used? Training Set S x1=(f11,f12,…f1m) x2=(f21,f22, f2m) . . xn=(fn1,f22, f2m) What values? Quinlan suggested information gain in his ID3 system and later the gain ratio, both based on entropy.
Using Information Gain to Construct a Decision Tree 1 Choose the attribute A with highest information gain for the full training set at the root of the tree. Full Training Set S Attribute A 2 v2 v1 vk Construct child nodes for each value of A. Each has an associated subset of vectors in which A has a particular value. Set S S={sS | value(A)=v1} 3 repeat recursively till when?
Simple Example Training Set: 3 features and 2 classes X Y Z C • 1 1 I 11 0 I 0 0 1 II 1 0 0 II How would you distinguish class I from class II?
X Y Z C • 1 1 I 11 0 I 0 0 1 II 1 0 0 II Eparent= 1 Split on attribute X If X is the best attribute, this node would be further split. I I II X=1 Echild1= -(1/3)log2(1/3)-(2/3)log2(2/3) = .5284 + .39 = .9184 I I II II II X=0 Echild2= 0 GAIN = 1 – ( 3/4)(.9184) – (1/4)(0) = .3112
X Y Z C • 1 1 I 11 0 I 0 0 1 II 1 0 0 II Eparent= 1 Split on attribute Y I I Y=1 Echild1= 0 I I II II II II Y=0 Echild2= 0 GAIN = 1 –(1/2) 0 – (1/2)0 = 1; BEST ONE
X Y Z C • 1 1 I 11 0 I 0 0 1 II 1 0 0 II Eparent= 1 Split on attribute Z I II Z=1 Echild1= 1 I I II II I II Z=0 Echild2= 1 GAIN = 1 – ( 1/2)(1) – (1/2)(1) = 0 ie. NO GAIN; WORST
Portion of a training set for character recognition Decision tree for this training set. What would be different about a real training set?
feature vector class (square, red) I (square, blue) I (circle, red) II (circle blue) II (triangle, red) I (triangle, green) I (ellipse, blue) II (ellipse, red) II Try the shape feature I I I I II II II II Entropy? square ellipse circle triangle I I II II I I II II Entropy? Entropy? Entropy? Entropy? GAIN?
feature vector class (square, red) I (square, blue) I (circle, red) II (circle blue) II (triangle, red) I (triangle, green) I (ellipse, blue) II (ellipse, red) II Try the color feature I I I I II II II II Entropy? red blue green Entropy? Entropy? Entropy? GAIN?
Many-Valued Features • Your features might have a large number of discrete values. Example: pixels in an image have (R,G,B) which are each integers between 0 and 255. • Your features might have continuous values. Example: from pixel values, we compute gradient magnitude, a continuous feature
Solution to Both • We often group the values into bins R [0,32) [32,64) [64,96) [96,128) [128,160] [160,192) [192,224) [224,255]
Training and Testing • Divide data into a training set and a separate testing set. • Construct the decision tree using the training set only. • Test the decision tree on the training set to see how it’s doing. • Test the decision tree on the testing set to report its real performance.
Measuring Performance • Given a test set of labeled feature vectors e.g. (square,red) I • Run each feature vector through the decision tree • Suppose the decision tree says it belongs to class X and the real label is Y • If (X=Y) that’s a correct classification • If (X<>Y) that’s an error
Measuring Performance • In a 2-class problem, where the classes are positive or negative (ie. for cancer) • # true positives TP • # true negatives TN • # false positives FP • # false negatives FN • Accuracy = #correct / #total = (TP +TN) / (TP + TN + FP + FN) • Precision = TP / (TP + FP) How many of the ones you said were cancer really were cancer? • Recall = TP / (TP + FN) How many of the ones who had cancer did you call cancer?
More Measures • F-Measure = 2*(Precision * Recall) / (Precision + Recall) Gives us a single number to represent both precision and recall. In medicine: • Sensitivity = TP / (TP + FN) = Recall The sensitivity of a test is the proportion of people who have a disease who test positive for it. • Specificity = TN / (TN + FP) The specificity of a test is the number of people who DON’T have a disease who test negative for it.
Measuring Performance • For multi-class problems, we often look at the confusion matrix. assigned class A B C D E F G A B C D E F G C(i,j) = number of times (or percentage) class i is given label j. true class
Error here means (1 – accuracy). Hypothesis here means classification by the decision tree.
What happens as the decision tree gets bigger and bigger? Error on training data goes down, on testing data goes up
On training data it looks great. But that’s not the case for the test data. The tree is pruned back to the red line where it gives more accurate results on the test data.
Decision Trees: Summary • Representation=decision trees • Bias=preference for small decision trees • Search algorithm=none • Heuristic function=information gain or information content or others • Overfitting and pruning • Advantage is simplicity and easy conversion to rules.