Download
1 / 47
480 likes | 681 Vues
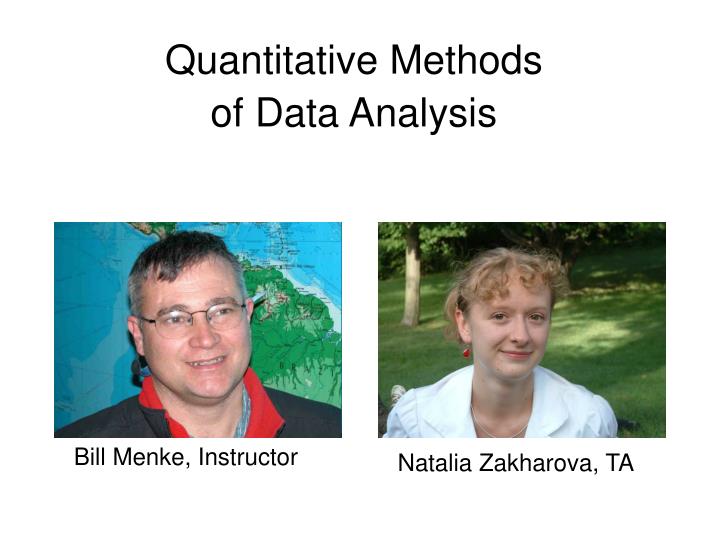
Quantitative Methods of Data Analysis. Bill Menke, Instructor. Natalia Zakharova, TA. Goals. Make you comfortable with the analysis of numerical data through practice Teach you a set of widely-applicable data analysis techniques

E N D
Quantitative Methods of Data Analysis Bill Menke, Instructor Natalia Zakharova, TA
Goals Make you comfortable with the analysis of numerical data through practice Teach you a set of widely-applicable data analysis techniques Provide a setting in which you can creatively apply what you’ve learned to a project of your own choosing
SYLLABUS September 03 (W) Intro; Issues associated with working with data September 08 (M) Issues associated with coding; MatLab tutorialSeptember 10 (W) Linear Algebra Review; Least SquaresSeptember 15 (M) Probability and UncertaintySeptember 17 (W) Variance and other measures of error, bootstrapsSeptember 22 (M) The principle of maximum likelihoodSeptember 24 (W) Advanced topics in Least-Squares, Part 1September 29 (M) Advanced topics in Least-Squares, Part 2October 01 (W) Interpolation and splinesOctober 06 (M) Hypothesis testingOctober 08 (W) Linear systems, impulse response & convolutionsOctober 13 (M) Filter TheoryOctober 15 (W) Applications of FiltersOctober 20 (M) Midterm ExamOctober 22 (W) Orthogonal functions; Fourier seriesOctober 27 (M) Basic properties of Fourier transformsOctober 29 (W) Fourier transforms and convolutionsNovember 03 (M) Sampling theoryNovember 05 (W) spectral analysis; power spectraNovember 12 (W) statistics of spectra; practical considerationsNovember 17 (M) wavelet analysisNovember 19 (W) Empirical Orthogonal FunctionsDecember 01 (M) Adjoint methodsDecember 03 (W) Class project presentationsDecember 08 (M) Review for Final
Homework Assigned on a weekly basis Due Mondays at the start of class Due in hardcopy; arrange so that the numbered problem (typically 1, 2, and 3) can be physically separated from one another Advice: start early; seek assistance of classmates, TA and me (in that order)
Project Substantial and creative analysis of a dataset of your choice Chance to apply a wide suite of techniques learned in this class in a realistic setting might (or might not) be part of your research; might (or might not) lead to a paper
Project Dates September 17 (W) 1-page abstract due; then schedule brief meeting with me November 05 (W) Progress report due December 03 (W) Brief presentation of results in class December 08 (M) Hardcopy of Project Report due at start of class
Grading Homework 20% Midterm 15% Final 15% Project 50% You should read my grading policy: www.ldeo.columbia.edu/users/menke/gradingpolicy.html
Software Excel point-and-click environment little overhead for quick analysis hard to automate repetitive tasks hard to document operations columns, rows of data cell-oriented formulas MatLab scripting environment some overhead, so less quick easy to automate repetitive tasks easy to document operations vectors and matrices of data general programming environment
Survey • Calculate this sum w/o electronic • assistance: 472+964+674+2 = ______ THEORY 1. Put an x in this triangle that represents your expectation for your career 4. Plot the function y(x) = 1 + 2x + 3x2 on this graph: LAB & FIELD WORK DATAANALYSIS 2. Have you had a course that included (check all that apply) matrices & linear algebra probability and statistics vector calculus computer programming 5. Estimate the number of minutes it would take you to walk from Morningside to Lamont: ______.
The Nature of Dataplease readDoug Martinson’s Part 1: Fundamentals(available under Courseworks)
Key Ideas How data were estimated is important! Data are never perfect; inherently contain error You analyze data to learn something specific; not to show virtuosity with some analysis method! A scientific objective must be clearly-articulated; the analysis method must fit the objective.
Data Lingo Discrete vs. Continuous data is always discrete (a series of individual numbers, such as a sequence of readings off of a thermometer) even though the process being observed may be continuous (the temperature of the room, which varies continuously as a function of time and space)
Sequential vs. non-sequential Data data often has some sort of natural organization, the most common of which is sequential, E.g. temperature of this room, measured every fifteen minutes temperature right now along the hallway, measured every thirty centimeters Such data is often called a time-series, even in the case where the organization is not based on time, but on distance (or whatever) …
Multivariate Data while a time-series is the data analog of a function of one variable, e.g. f(t) a multivariate dataset is the data analog of a function of two or more variables, e.g. f(x,y) My photo, at left, is one such multivariate dataset, because the digital camera that captured the image was measuring light intensity as a function of two independent spatial variables. There are 300,000 individual measurements in this (relatively low resolution) image.
Precision and Dynamic Range Any measurement is made only to a finite number of decimal places, or precision. It can make a big difference whether the measurement is to one decimal place, 1.1, or to 7, 1.096752 A sequence of values will vary in size. The dynamic range quantifies the ratio of the largest value to the smallest (non-zero) value*. It can make a big difference if all the data vary in the range 1.0046-1.0062 or 1.0046-11018. * See Doug’s notes for the exact definition, which involves a logarithm
Vectors and Matrices A list of measurements (d1, d2, d3 .. ) can be organized very effectively into a vector, d. A table of data site1 site2 site3 time1d11 d12 d13 time2d21 d22 d22 time3d31 d32 d32 can be organized very effectively into a matrix, D. As we will see during the semester, the algebra of vector and matrix arithmetic can then be used very effectively to implement many different kinds of data analysis
Precision* vs. Accuracy precision – repeatability of the measurement what is the scatter if you make the measurement many times? Accuracy - difference between the center of a group of scattered measurements and the true value of what you’re trying to measure * Note the different sense of the word precision than 3 slides ago.
Signal-to-Noise Ratio Error in the data compare to Size of the data The size of the error is most meaningful when compared to the size of the data
Biggest peak has a period of exactly one year … makes sense, it’s the annual cycle in river flow But what about these smaller peaks?
Daily Temperature 1947-2008 at Laguardia Airport (LGA), New York, NY I’m suspicious of these ‘exacly zero’ values. Missing data, defaulted to zero, maybe?
Laguardia Airport (New York, NY) Temperature vs. Precipitation
Mean precip in a given one-degree temperature range Related to: Conditional probability that it will rain, given the temperature?
Ground motion here at Lamont on August 28 2008 Here’s an earthquake But what are these little things?
A simple filtering technique to accentuate the longer, clear periods in the data Little similar looking earthquakes and lots of them! Here’s an earthquake
A little case study:correlation of dN-15 and dustin the Vostok Ice Core
ftp://ftp.ncdc.noaa.gov/pub/data/paleo/icecore/antarctica/vostok/dustnat.txtftp://ftp.ncdc.noaa.gov/pub/data/paleo/icecore/antarctica/vostok/dustnat.txt Ice age (GT4) Dust Conc (ppm) 4509 0.025 4552 0.018 4690 0.015 5259 0.033 5674 0.028 6486 0.013 ... 417095 0.013 420527 0.015 421761 0.012 (522 lines of data) A little Googling indicates that dust data readily available on web Given as age vs. dust concentration, assuming the GT4 age model (which relates depth in the ice core to age) About 1 sample per few hundred years at the too of the core, declining to one sample per few thousand years at the bottom
ftp://sidads.colorado.edu/pub/DATASETS/AGDC/bender_nsidc_0107ftp://sidads.colorado.edu/pub/DATASETS/AGDC/bender_nsidc_0107 Vos_O2-N2_isotope_data_all.txt Core Depth dN15 dO18dO18atm dO2/N2 5G 174.5 0.49 1.09 0.11 -28.2 5G 174.5 0.56 1.14 0.01 -35.2 5G 185.2 0.58 0.97 -0.19 -26.4 ... 5G 3342 0.53 1.73 0.67 -9.7 5G 3342 0.53 1.70 0.63 -10.6 5G 3348 0.48 1.21 0.24 -7.2 (572 lines of data) Vostok_EGT20_chronology.txt Depth EGT20 ice EGT20 *ageEGT20 gas age 150 5.721 3.319 2.402 • 5.769 3.307 2.462 • .152 5.816 3.306 2.51 ... 3347 454.327 3.106 451.221 3348 455.621 3.652 451.969 • 456.943 4.137 452.806 (3200 lines of data) dN15 data also readily available on web Given as depth vs. dN15 Roughly the same number of lines of data (so presumably similar age sampling) EGT20 chronology given; presumably different (but by how much?) than GT4 Age of air in ice and be as much as 4000 years younger than age of ice itself
Decision: Compare data at same depth in ice (probably not so sensible) same age (probably more sensible) Need then to convert dN15 depth to dN15 (gas) age (we ‘ve found the conversion table) (some sort of interpolation probably necessary, how much error will that introduce? ) dust GT4 age EGT20 age (we need to look for the conversion table) Need to deal with the likely problem that the sampled ages of the dust will not match the ages of the dN15 (how much error will interpolation introduce?)
Start Simple ! Don’t launch into time-consuming analyses until you’ve spent time… … gathering background information ... learning enough about a database to have some sense that it really contains the information that you want … retrieving a small subset of the data and looking them over carefully
Look at your data!look at the numerical values (e.g, in spreadsheet format)graph it in a variety of waysyou’ll pick up on all sorts of useful - and scary –things
Where do I get data ? You collect it your self through some sort of electronic instrumentation You compile it manually from written sources A colleague gives it to you (e.g. emails you a file) You retrieve it from some sort of data archive (e.g. accessible through the web)
Don’t Be Afraid to Ask … … technicians familiar with instrumentation … authors of paper that you have read … your colleagues ... data professionals at mission agencies
Learn how the data were collected What was really measured Hidden assumptions and conversion factors The number of steps between the measurement and the data as it appears in the database
Who are the people who collected the data Who performed the actual measurements? How many different people over what period of time? What kind of quality control was performed? Are you accessing the original database or somebody’s copy?
What are the data’s limitations? How much is nonsense? (Typically 5% of data records in compilations have errors) What is the measurement accuracy? (Are formal error estimates given?) Perform sanity checks on both the data and your understanding of it. Compare similar data from different databases. Identify and understand differences.
data analysis can be messy Many files, some of them very large Many steps in the analysis process including rather tedious data re-formatting Possibly many versions of an analysis exploring different choices in analysis Lots of output … tables, graphs, etc.
Organization very important Well-designed directory (folder) structure Disciplined use of filenames Ongoing documentation of the analysis process, and especially of the big picture
Quandry How much to keep … How much to delete …
Advice #1 Always keep a copy of the unaltered raw data (and make sure that you identify it as such)
Advice #2 Always keep anything that you type in manually (notes, MatLab scripts, references, etc) with the theory that you couldn’t possibly type fast enough to consume significant storage space.
Advice #3 Whenever possible, design and use a single script that recreates a sensible part of your work. You can use it to recreate anything you’ve deleted, and also documents what you’ve done.
Advice #4 If you do delete a large chunk of your work, leave the top directory and put in a note to yourself explaining what you’ve deleted … and why