Download
1 / 34
360 likes | 495 Vues
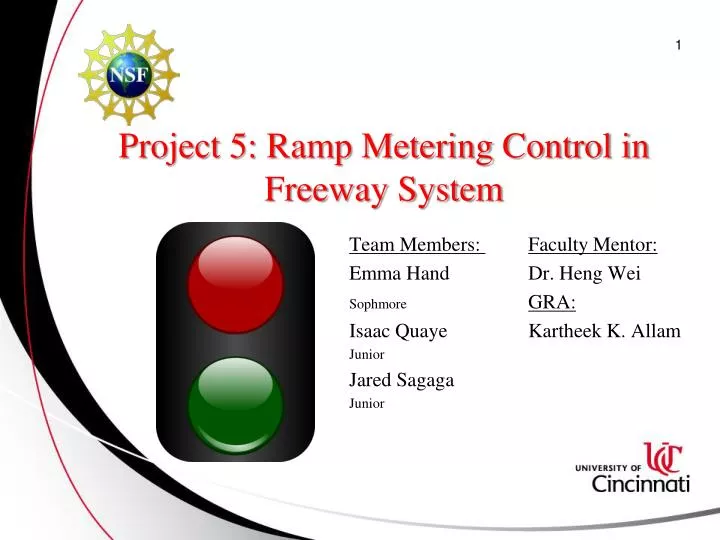
Project 5: Ramp Metering Control in Freeway System. Team Members: Faculty Mentor: Emma Hand Dr. Heng Wei Sophmore GRA: Isaac Quaye Kartheek K. Allam Junior Jared Sagaga Junior. 2. Sponsor. Grant ID No.: DUE – 0756921 EEC – 1004623. 3. Outline. Introduction

E N D
Project 5: Ramp Metering Control in Freeway System Team Members: Faculty Mentor: Emma Hand Dr. Heng Wei SophmoreGRA: Isaac Quaye Kartheek K. Allam Junior Jared Sagaga Junior
2 Sponsor Grant ID No.: DUE – 0756921 EEC – 1004623
3 Outline • Introduction • Scope of study, goals and tasks • Training • Data Collection • Methodology • Results • Timeline
4 National Statistics • Average time spent on highway (NHTSA 2009) • Student: 1.3 hours/day • Working: 1.5 hours/day • 36 hours/year in traffic Source: NHTSA
5 National Statistics (cont.) • 32,885 people died in motor vehicle traffic crashes in 2010 (NHTSA) • 5,419,000 total crashes on highway, 29% caused injury or were fatal • 33% crashes occur on freeway stretch with bridges or interchanges (2011) • $871 BILLION in economic loss and societal harm
6 What can fix this? Ramp Meters Source: Reference 10
7 What are Ramp Meters? • Traffic controls that regulate traffic flow entering a highway Source: Reference 6
8 Why Ramp Meters? • Reduces congestion • Improves throughput (up to 62%) • Decreases time spent staring at brake lights • Reduces travel time (20-61%) • Improves travel time reliability • Ensures the safety of vehicles (5-43% decrease in accidents)
9 Types of Ramp Metering • Fixed time • Pre-timed meter cycle based off of past data • Responsive • Meter cycles vary depending on changes in traffic conditions
10 Ramp Metering System Signal Controller Metering Signal Arterial
11 Meters Across the US Seattle: 232 Minn-St. Paul: 444 Oregon: 150 Wisconsin: 38 Wisconsin: 80 Ohio: 34 New York: 75 Chicago: 117 Salt Lake Washington D.C.: 24 City: 23 Denver: 54 N. Virginia: 26 California: 3471 St. Louis: 1 Phoenix: 233 Atlanta: 170 Texas: 115 Implemented - Responsive Florida: 22 In Progress - Responsive In Progress - Fixed
12 Scope of Study • Conducted research on the study site (East-Bound I-275) by gathering data using traffic counter and GPS travel data logger • Criteria • Elevated locations nearby for placing the camcorder to capture the traffic • Location should be busier in the peak hours than the normal flow of freeway • Investigated both a one and two lane ramp implementation in VISSIM
13 Goals • Gain background knowledge and training for research project • Collect and process data from GPS data logger and traffic counter • Investigate • Effectiveness of one and two lane ramp implementation • Successfully run simulations in VISSIM • Present completed deliverables
14 Tasks • Equipment and software training • Utilized GPS software (QTravel) • Generated VISSIM network model using processed data • Analysis of simulation results • Assembled research findings
15 Training • GPS and traffic counting • QTravel • Extracted data collected from field trips • VISSIM Software • Simulation set up • Data input and analysis • Calibration and validation
16 Data Collection Study Site I-275 Reed Hartman Highway Legend Mosteller Road East-Bound Sections
17 Data Collection (cont.)
18 Data Collection (cont.) List of Videos Completed Sample Data
19 Data Collection (cont.) QTravel
Methodology 20 Data Collection Study Site One Lane Ramp Run Simulation Validation VISSIM Training Two Lane Ramp Simulation Setup Results Calibration
21 Simulation Network Model
22 Calibration and Validation • Calibration • Desired speeds • Routing decisions • Driving behavior • Validation • Speed (+ 10%) • Travel Time (+ 15%) • Volume
23 Calibration and Validation (cont.) Travel Time PASS Speed PASS
24 Results One Lane On-Ramp Without Ramp Meter One Lane On-Ramp With Ramp Meter
25 Results (cont.) Two Lane On-Ramp Without Ramp Meter Two Lane On-Ramp With Ramp Meter
26 Results (cont.)
27 Results (cont.) • Decrease in standard deviation • MZ = Merge Zone • NMZ = Non-Merge Zone
28 Results (cont.) • Increase in Speed • MZ = Merge Zone • NMZ = Non-Merge Zone
29 Results (cont.)
30 Conclusion • No significant change in overall speed and travel time • Significant change in sectional average speed and speed variation • Ramp meters are more effective on two-lane on-ramps in increasing safety
31 Timeline Legend Complete
32 References • Zongzhong, T., Nadeem, A. C., Messer, C. J., Chu, C. (2004). “Ramp Metering Algorithms and Approaches for Texas,” Transportation Technical Report No. FHWA/TX-05/0-4629-1, Texas Transportation Institute, The Texas A&M University System, College Station, Texas. • Yu, G., Recker, W., Chu, L. (2009). “Integrated Ramp Metering Design and Evaluation Platform with Paramics,” California PATH Research Report No. UCB-ITS-PRR-2009-10, Institution of Transportation Studies, University of California, Berkley, California. • Kang, S., Gillen, D. (1999). “Assessing the Benefits and Costs of Intelligent Transportation Systems: Ramp Meters,” California PATH Research Report No. UCB-ITS-PRR-99-19, Institution of Transportation Studies, University of California, Berkley, California. • Arizona Department of Transportation. (2003). Ramp Meter Design, Operations, and Maintenance Guidelines. • Papamichail I., and Papageorgiou, M. (2008). “Traffic-Responsive Linked Ramp-Metering Control,” IEEE Transactions on Intelligent Transportation Systems, Vol. 9, No. 1, n.p.
33 References (cont.) • Federal Highway Administration, USDOT (2013). “FHWA Localized Bottleneck Program.” <http://ops.fhwa.dot.gov/bn/resources/case_studies/madison_wi.htm> (Accessed 6/9/2014) • Maps, Google (2014). <https://www.google.com/maps/search/homewood+suites+near+Hilton+Cincinnati,+OH/@39.2885017,-84.399993,83m/data=!3m1!1e3?hl=en> (Accessed 6/30/2014). • Maps, Google (2012). <https://www.google.com/maps/@39.288408,-84.399636,3a,75y,243.6h,66.31t/data=!3m4!1e1!3m2!1si7sOFQJVai_eF3v7k8u_LQ!2e0> (Accessed 6/30/2014). • https://www.fhwa.dot.gov/policy/ohim/hs06/htm/nt5.htm • http://www-nrd.nhtsa.dot.gov/Pubs/811741.pdf • http://content.time.com/time/nation/article/0,8599,1909417,00.html • http://www.academia.edu/2899596/Crashes_and_Effective_Safety_Factors_within_Interchanges_and_Ramps_on_Urban_Freeways_and_Highways • http://www.fairfield.ca.gov/latest_news/displaynews.asp?NewsID=447 • http://www-nrd.nhtsa.dot.gov/Pubs/811552.pdf
34 Questions