Download
1 / 50
500 likes | 600 Vues
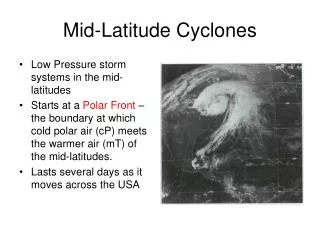
Workshop on Processes Controlling Chemical Composition of the Mid-latitude UTLS Mainz, Germany, May 2005 Topic #4 : How can we quantify the net exchange of ozone and other trace species between the extra-tropical stratosphere and the troposphere ? Laura Pan & Michael Prather.

E N D
Workshop on Processes Controlling Chemical Composition of the Mid-latitude UTLS Mainz, Germany, May 2005 Topic #4: How can we quantify the net exchange of ozone and other trace species between the extra-tropical stratosphere and the troposphere? Laura Pan & Michael Prather Introduction – What do we know about net STE of O3 ? Michael Prather (Models) & Laura Pan (Observations) STE diagnostics from a CTM using Oslo/EC met fields Michael Prather & Juno Hsu Earth System Science Department UC Irvine
What do we know about the global mean STEx net flux of O3 from semi-empirical 'modeling' based on correlations ?
What do we know about the global mean STEx net flux of O3 from semi-empirical 'modeling' based on correlations ? Tg-O3/yr Murphy & Fahey, 1994 N2O-O3 450 ± large Gettelman, 1997 O3-N2O-CH4-CF2Cl2 510 ± ? McLinden / S. Olsen, 2000+ N2O-NOy-O3 550 ± 140 M. Olsen, 2002 PV-O3 500 ± 140 What do we get from CTMs ?
IPCC – TAR tropospheric O3 modeling: Yr1990 atmosphere trop O3 budgets (Tg-O3/yr)
IPCC – AR4 tropospheric O3 modeling: S1 Yr2000 atmosphere trop O3 budgets (Tg-O3/yr) (Stevenson, Dentener et al.)
IPCC – AR4 tropospheric O3 modeling: S1 Yr2000 atmosphere Sinf = inferred net STEx (all Tg-O3/yr)
IPCC – AR4 tropospheric O3 modeling: S1 Yr2000 atmosphere at least the average is OK
We are doing better at simulating observed events CTM stratospheric folds DC-8 LIDAR
Tropospheric O3 statistics identify STE. Observed / Modeled CO-O3 along flight tracks gives STE probability.
90th %ile DC8 LIDAR Tropospheric O3 statistics identify STE. CTM simulated LIDAR CTM full 4-D Stratospheric O3 from jet region entering tropical troposphere
380K tropopause
CTM: Oslo/EC pieced spun-up forecast 40/37 layers (~600 m) T63/42 (1.9o/2.8o) Linearized strat O3 chem (Linoz) O3 sink in BL (uniform e-fold) Modeled O3 (in ppb) & Θ (in 10K intervals) (annual mean) L=33+
New approach: we calculate mass budgets for tropospheric O3 if a parcel has O3 < 100 ppb, it is tropospheric tropospheric column flux-divergence (Ft-t) is calculated STE O3 flux resolved by latitude, longitude, time
Stratospheric O3 is counted as net STE only when it has diluted below 100 ppb. This occurs at the interface
Westerly Duct STE event on 13-14-15 March 2001 as seen in column O3 western Pacific TOMS CTM
Westerly Duct STE event on 13-14-15 March 2001 modeled on 330K surface
Westerly Duct STE event on 15 March 2001 – integrated STE O3 flux
N.B. Only a fraction of the observed/modeled O3 column anomaly enters the troposphere (0.3 Tg), the bulk returns to stratosphere 15 March 2001 Ozone Column Anomaly (DU) TOMS 0.9 Tg 1.7 Tg UCI CTM
Monthly STE O3 flux – N.B. blue regions are 'noise' STE O3 zonal wind
Tibetan Plateau in May – a hot spot for STE of O3 rapid rise of tropopause May
Tests of resolution: Monthly STE vs. Latitude, T63 vs. T42 ?
NH SH SH NH chemistry cut off at 100 ppb chemistry down to 12 km
CTM modeled STE O3 flux (Tg) NH ~ SH 2000/2001 NH > SH 1997 Total 530 ± 50? (due to lower/upper b.c.) N.B. ~80 Tg from J-O2 in tropical trop
BUT, there is considerable O3 Production near and below the 100 ppb surface
N.B. Photolysis of O2 is a significant source (>20 ppb) of trop O3 in upper tropics J-O2 J-O2 XXHO2+NO
Diagnose O3 flux into lower stratosphere: ~675 Tg crosses L=33 (~?380K) 600 Tg crosses 1000 ppb surface . . . 527 Tg crosses 100 ppb surface into troposphere! ? what observations can test this modeled 25% loss of the O3 flux ~380 K troposphere
Given Climate Change, what can we expect for changes in O3 . . .
Given Climate Change, what can we expect for changes in O3 . . .