Download
1 / 23
230 likes | 333 Vues
2012 General Election. What Happened? Prepared for MAHP November 15, 2012. 1992 – 2012 Composition Of The Electorate (based on exit polling). White. Age 18-29. Black. Hispanic. 1992 – 2012 Composition Of Partisan Presidential Vote, By Ethnicity. Asian. Asian. Hispanic. Hispanic.

E N D
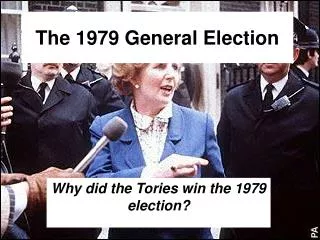
2012 General Election What Happened? Prepared for MAHP November 15, 2012
1992 – 2012 Composition Of The Electorate(based on exit polling) White Age 18-29 Black Hispanic
1992 – 2012 Composition Of Partisan Presidential Vote, By Ethnicity Asian Asian Hispanic Hispanic Black Black White White
Six Keys To The 2012 Presidential • Tax Policy • George W. Bush • Empathy • Health Care Reform • Hurricane Sandy • Voter Suppression Efforts
2012 Turnout Appears To Be Down From 2008, With Significant Variation By State (based on AP reporting as of Tuesday Nov. 13, 2012) Turnout Increases: Top 10 States Turnout Decreases: Top 10 States 2008 Total Votes: 129,449,593 2012 Total Votes: 121,190,681 Change: - 4.5% *Competitive Senate race
Unsurprisingly, The Economy Was Viewed As The Most Important Issue Facing The Country On Election Day Which ONE of these four issues is the most important facing the country? (CHECK ONLY ONE) Support among those indicating issue as the most important The economy Health care Federal budget deficit Foreign policy
Evaluations Of The Economy Remain Dismal, But Are Notably Better Than 4 Years Ago Do you think the condition of the nation’s economy is: excellent , good, not so good, or poor?
Most Voters Still Blame George W. Bush For Economic Problems Who is more to blame for current economic problems? Not sure 9% Obama 38% Bush 53%
6-in-10 Voters Favor Higher Tax Rates For Those Earning Over $250,000 Should income tax rates: increase for all, increase only on income over $250,000, or not increase for anyone? Not sure 5% Not increase for anyone 35%
Obama Dominated Vote Among Those Most Interested In A Caring President Which ONE of these four candidate qualities mattered most in deciding how you voted for president? (CHECK ONLY ONE) Support among line-item respondents Has a vision for the future Shares my values Cares about people like me Among Blacks: 38% Among Hispanics: 28% Is a strong leader
Majority of Voters Think Obama Is More In Touch With People Like Them, Especially Young, Non-White Voters Who is more in touch with people like you? Not sure 4% Obama 53% Romney 43%
Deep Divisions Persist On Health Care Law, But Only One-Quarter Of Voters Supported Romney’s Position To Repeal It What should happen to the 2010 health care law? Support among line-item respondents Expand it Leave it as is Repeal some of it Repeal all of it
Obama Edged Romney Among Late Deciding Voters When did you finally decide for whom to vote in the presidential election? Support among line-item respondents Just today / In the last few days In October In September Before that
Hurricane Sandy Appears To Have Moved Some Voters To Obama In your vote for president, how would you rate the importance of Obama’s hurricane response? Support among line-item respondents The most important factor An important factor A minor factor Not a factor at all
Turnout Analysis Counties won by Brown in 2010
Turnout In The Biggest Cities Provided Warren With Much Of Her Winning Margin
Brown Viewed More Favorably Than Warren Among Election Day Voters Is your opinion of (candidate): favorable or unfavorable?
Thank you! Chris Anderson 617.742.3766 Chris@andersonrobbins.com Anderson Robbins Research 6 Beacon Street, suite 720 Boston, MA 02108