Download
1 / 15
150 likes | 290 Vues
Accelerate Oil & Gas 2013. Osvaldo Capmany. FTSE 100 company Market cap* c.£3.6 billion Revenues Some £ 4.2 billion Employees Over 2 9 ,000 Working in Around 40 countries Key markets Oil & gas, minerals & metals, clean energy, environment & infrastructure. Environment &

E N D
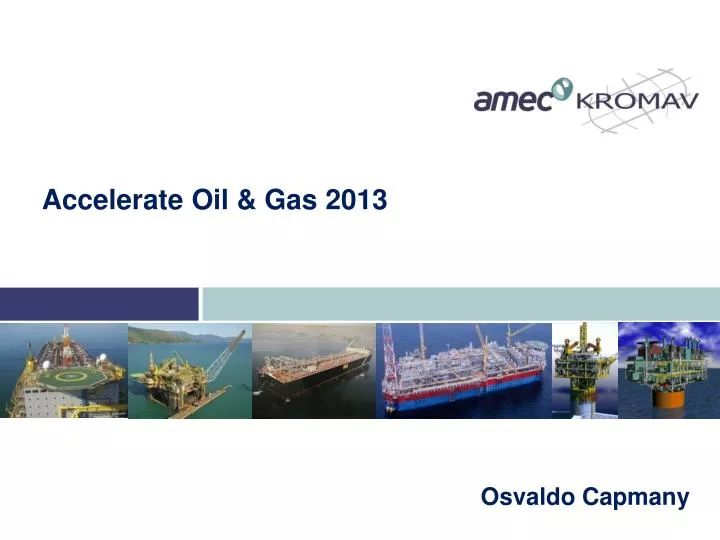
AccelerateOil & Gas 2013 Osvaldo Capmany
FTSE 100 company Market cap* c.£3.6 billion • Revenues Some £4.2 billion • Employees Over 29,000 • Working in Around 40 countries • Key markets Oil & gas, minerals & metals,clean energy, environment & infrastructure Environment & Infrastructure Mining Clean Energy Oil & Gas Delivering excellence * As at 11 July 2012
Global capability, local delivery CentricaEast IrishSea EPC contract BGcontractNorth Sea FairfieldEnergyDunlinDutyholder EssarStanlow refinery Integrated Maintenance ShellLeman Conoco PhillipsJudyandJasmine BP onshore& offshoreassets Azerbaijan BluewaterFPSOs Engineering & Maintenance Major oil & gas contracts Imperial OilKearloil sands GDF SUEZE&P UK Cygnus FEED IvanhoeEnergy TamarackProject Al-Khafji Joint Operations (AKJO) KOC PMC Kuwait BP NorthSeaprojects BP GlobalAgreementClair Ridge,and Mad Dog INPEX Ichthys FEED SABIC Petrochemicals Integrated Maintenance & Turnaround ChevronAlder Concept Hook-on module interface ExxonMobilKizombaSatellites QGC QueenslandCurtis LNG BOLLong Term Compression Mono-column & interface Apache Forties Alpha Satellite Platform Brownfield mods
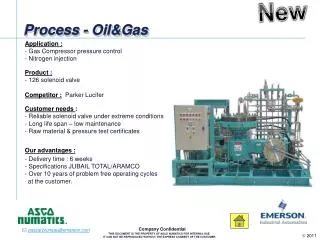
Oil & Gas and Marine Services – offers services in design, delivery and commissioning of major upstream oil and gas projects, the hook-up and commissioning of platforms, project and programme management and operations support and maintenance. Oil and Gas
Natural Resources current areas of operation Oil & Gas 61%* Oil Sands 22%* Mining 17%* mining Upstream 85% Midstream 10% Downstream 5% * Revenues 2008
Oil & Gas – AMEC’s position Well positioned across a mix of activities
Brazil Oil and Gas Production Curve Piloto Sapinhoá (Cid. São Paulo) Piloto Lula NE (Cid. Paraty) Papa-Terra (P-61 e P-63) Roncador III (P-55) Norte Pq. Baleias (P-58) Roncador IV (P-62) Sapinhoá Norte (Cid. Ilhabela) Iracema Sul (Cid. Mangaratiba) Iracema N Lula Alto Lula Central Lula Sul Franco 1 Carioca 1 Lula Norte Franco 2 Lula Ext. Sul Iara Horst NE Tupi Carimbé Aruanã Iara NW Franco 3 Franco 4 Sul de Guará Jupiter Carcará Sul Pq. Baleias Franco 5 Espadarte I Maromba Bonito Entomo de Iara Espadarte III Florim Baleia Azul (Cid. Anchieta) Baúna e Piracaba (Cid. Itajaí) UEPs: 19 till 2016 38 till 2020 mbpd – million barrels per day Brazil - Oil & Gas Production (mbpd) Includes new opportunities in blocks where there are already discovered. Source: PETROBRAS Business Strategic Plan 2020
PETROBRAS Brownfield Operation Performance Objectives improvement in the level of operational efficiency Increased reliability of oil supply curve under PN 12-13 Improvement of production systems integrity OperationalEfficiencyGoals Operation Performance Campos Basin Performed PROEF Goals Source: PETROBRAS PROEF • PETROBRAS has launched PROEF program (Increase Efficiency) in E & P activities in the Campos Basin. • By 2016 U.S. $ 5.6 billion will be invested. The estimated return is between $ 1.6 billion and $ 3.3 billion.
Market Needs • Skilled manpower; • OperationandMaintenance Sectors forOffshoreUnits; • Local Industry Capability for Materials, Equipments and Services; • Local Content Policy; • Provision of Logistics and Power Generation for supporting Pre-salt Offshore Units; • Efficient Transport Systems for Oil and Gas operations in the Pre-salt fields. • New Floating Facilities. • Deep water facilities.
OUR CAPABILITIES Conceptual, Basic and Front End Engineering Design (FEED) • Technical Descriptions • General Arrangement • Process Simulation • PFDs and P&IDs • Process Studies • Layout Plans • Model Test Report Analysis • Structural Calculations (FEM) • Electric, Instrumentation and Telecom • Technical Specifications and Data Sheets • Vendor´s Technical Proposal Review • Vendor’s Drawing Approval
OUR CAPABILITIES Detailed Engineering Design (DED) • Assembly Drawings • Piping Arrangement • Isometric Drawings • Structural Drawings • Ventilation Duct Drawings • Cable Way Drawings • Fabrication & Shop Drawings • Spool Piece Drawings • Pipe Support Drawings • Outfitting Fabrication Drawings • Structural Fabrication Drawings • Material List • Parts List