Download
1 / 22
220 likes | 353 Vues
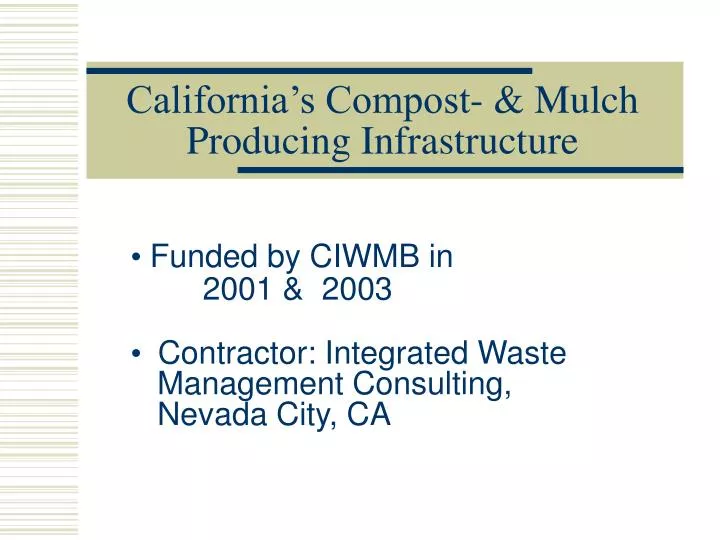
California’s Compost- & Mulch Producing Infrastructure. Funded by CIWMB in 2001 & 2003 Contractor: Integrated Waste Management Consulting, Nevada City, CA. Study Objective. Number of Compost & Mulch Producers Amount Diverted from Landfill Feedstock Sources Products

E N D
California’s Compost- & MulchProducing Infrastructure Funded by CIWMB in 2001 & 2003 Contractor: Integrated Waste Management Consulting, Nevada City, CA
Study Objective • Number of Compost & Mulch Producers • Amount Diverted from Landfill • Feedstock Sources • Products • Markets for Compost & Mulch • ADC Use
Study Design • Steering Committee • Independent Contractor • Promotional Campaign • Survey mail-out, Aggressive Follow-Up, Site Visits • Use of CIWMB Report on Landfill Green Waste ADC Use • Current Challenges to Organics Industry
Then Current Challenges • South Coast Air Quality Management District’s Proposed Rule 1133 • Sudden Oak Death Syndrome • Persistent Herbicides –Clopyralid
Survey Overview 20012003 Participating Operating Facilities 169 170 Composters 104 101 Processors 65 69 Operating Facilities Not Participating 11 32 Composters 5 16 Processors 6 16 Landfills Reporting Green Waste ADC Use N/A 58
Total Feedstock Processed(tons) 20012003 Composters 3,407,000 4,730,081 Processors 2,701,000 5,138,031 Total 6,108,000 9,868,112 * * Approximately 2.1 million tons of feedstock consists of green waste used as ADC.
2001 2003 Compost 4,232,000 3,011,182 Mulch 1,872,000 2,325,708 Boiler Fuel 3,446,000 3,872,983 ADC 2,795,000 8,482,372 Beneficial Reuse at Landfills N/A 258,150 Other 2,608,000 469,843 Total 14,953,000 18,420,238 Quantity of Product by Type2001 & 2003 (in cubic yards) “Other” includes products such as fines, wood chips, steer manure, bark products.
Key Findings • Number of facilities constant; 10 Million Tons Diverted • Ag is the largest single market for urban compost • CalTrans remains an untapped market • Large increase in ADC use --8.4 million cu (47% of market) • ADC use has impacted compost facilities in some regions of Ca. • 28% decline in Compost Production
Areas for Further Study • Study the impact of ADC on the compost industry • Identify those sectors of agricultural that buy compost • Work with CalTrans to increase market • Include financial and employment data in subsequent study
Implications of Study on CIWMB • Green Waste ADC Continues to Increase
Implications of Study on CIWMB-2- 2. Compost Production Decreased 28% • 45% Diversion 2003 33% Diversion 2001
Implications of Study on CIWMB-3- 4. Does Green Waste ADC Impact Compost Markets?