Download
1 / 31
310 likes | 449 Vues
NAEP Update. ESOL Coordinators Meeting November 17, 2010 Chris Webster, NAEP State Coordinator South Carolina Department of Education . Topics . Overview 2009 Results NAEP 2011 Inclusion. Overview. What is NAEP?. National Assessment of Educational Progress Ongoing assessment

E N D
NAEP Update ESOL Coordinators Meeting November 17, 2010 Chris Webster, NAEP State Coordinator South Carolina Department of Education
Topics • Overview • 2009 Results • NAEP 2011 • Inclusion
What is NAEP? • National Assessment of Educational Progress • Ongoing assessment • Representative sample • Valid cross-state comparisons • State- and national-level results • State grades 4 and 8 • National-grades 4, 8, and 12
What is NAEP? (cont.) • A project of the National Center for Educational Statistics (NCES) in the U.S. Department of Education • With passage of ESEA/NCLB, NAEP participation became required as of the 2003 administration • NAEP policy is set by the National Assessment Governing Board (NAGB)
Reporting • Subject-matter achievement • Instructional experiences • School environment • Populations of students • (e.g., All 8th grd. students) • Groups within populations • (e.g., SC ELLs)
Reporting • Average scale scores • Percentages at each performance level • Below Basic, Basic, Proficient, Advanced • Performance within and across jurisdictions • Changes over time
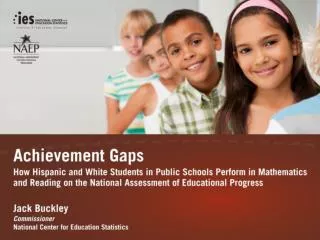
Reporting Results • The Nation’s Report Card • Special Studies • achievement gaps • mapping proficiency standards
Online NAEP Reporting Tools • State Profiles • State Comparisons • Data Explorer • Questions Tool Accessible at: http://nces.ed.gov/nationsreportcard/naepdata/
Reading Grade 4 Percent At/Above Basic
Reading Grade 8 Percent At/Above Basic
Mathematics Grade 4 Percent At/Above Basic
Mathematics Grade 8 Percent At/Above Basic
Conclusions • Largest ELL/non-ELL gaps in SC are in grade 4 reading and grade 8 math. • Largest gaps for the NP are in grade 8 reading and math. • SC smallest gaps are in grade 8 reading and grade 4 math. • Overall, there is less disparity between ELLs and non-ELLs in SC than the NP
2011 Sample 68 South Carolina Districts 4th Grade 109 schools 8th Grade 118 schools 12th Grade 14 schools 17
Assessment Components–2011 Operational Reading, mathematics (grades 4, 8), science (grade 8), writing computer-based (grades 8, 12). Pilot Reading, mathematics (grades 4, 8), economics (grade 12). 18
Components–2011 (cont.) Special Studies National Indian Education Study Status of education of native Americans and Alaska natives NAEP-TIMSS International Linking International benchmark for states (math/science) Mathematics Computer-Based Study Investigating computer-adaptive testing 19
English Proficiency Study • To inform the feasibility of attaining the NAGB objectives of enhanced reporting of disaggregated ELL results on NAEP, as well as provide useful information toward the feasibility of a NAEP screener. • Using NAEP data and results from several states’ ELP assessments
NAGB Policy Statement on Inclusion • Focus on states’ inclusion of ELLs and students with disabilities (SD) • Will begin flagging results in some way-(for high exclusion) • Recommended study of proficiency on various ELP tests and performance on NAEP
Participation Goals for ELLs • As a percentage of total population, total excluded (SD/ELL) should not be more than 5%. • Goal: Include 95% overall • As a percentage of the identified group, excluded should not exceed 15%. • Goal: Include 85% of all identified ELLs
Recent Exclusion-Mathematics Approx. 7 students % of ELLs Excluded Approx. 3 students
Recent Exclusion-Reading Approx. 37 students % of ELLs Excluded Approx. 41 students
Reasons for Exclusion • Reading • First year in U.S. schools ELA exemption • Bilingual (word-for-word) dictionary allowed on PASS…….Not allowed on NAEP
Reasons for Exclusion (cont.) • Mathematics • First year ELA exemption possibly being extended to math by some when completing questionnaire. • Other (applies to reading and math) • Possible misunderstanding of what is allowed on PASS (e.g., 34% indicated the student receives read aloud on reading (ELA))
Encouraging Participation • Participation Guidelines • Disseminated to DTCs and STCs in December • Designed to be used by school personnel when completing ELL worksheets • Encourage participation even if particular accommodation not allowed on NAEP
Encouraging Participation (cont.) • Parent/Guardian Notification Letter • A federal requirement that parents are notified of their child’s selection for NAEP. • Results are confidential (no student-level scores) • May be excused for any reason • Not required to finish assessment
More Information • Visit the NAEP Web page on ed.sc.gov • General information • Links to data analysis tools and released items • Resources for selected schools
Contact Chris Webster NAEP Coordinator Office of Assessment cwebster@ed.sc.gov 803-734-5721