Download
1 / 39
551 likes | 1.03k Vues
III. Bond and Stock Valuation. Textbook Chapter 4 and the bond section of Chapter 3. Professors Simon Pak and John Zdanowicz. Outline. Bonds Stock Valuation - Introduction Stock Price and Dividend Market Capitalization Rate, Discount Rate Stock Price, EPS, NPVGO Valuing A Firm. 1. BONDS.

E N D
III. Bond and Stock Valuation Textbook Chapter 4 and the bond section of Chapter 3 Professors Simon Pak and John Zdanowicz
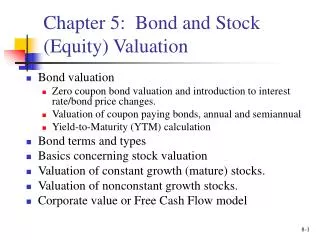
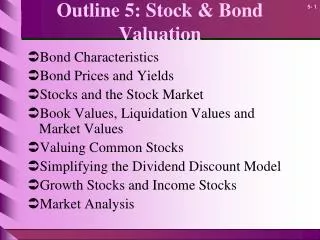
Outline • Bonds • Stock Valuation - Introduction • Stock Price and Dividend • Market Capitalization Rate, Discount Rate • Stock Price, EPS, NPVGO • Valuing A Firm
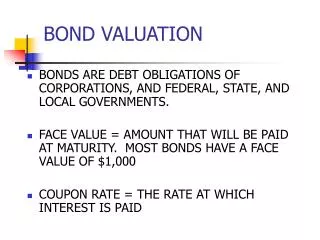
1. BONDS • Bond: A long-term debt by a company or by a government agency. • The issuer pays stated interest payment, coupon, every year until maturity. • The issuer also pays the principal, face value or par value, at maturity. • Yield = the discount rate at which PV of all CF’s from the bond equal to the price of the bond • Maturity sometimes casually used to refer to the remaining life of bond or current maturity • Denominations (or face values) of corporate bonds are typically $1,000. • Government bonds usually have greater par values. • Bond selling at par is selling “flat.” • Most US bonds pay interest semiannually • Price often stated as percentage of par value
0 1 2 . . . . N-1 N PRICEbond Coupon Coupon Coupon Principal Coupon yield = r 1.1 Bond Valuation The cash flows of a bond with maturity N years: [eg: $1,000 principal, 6% coupon, 10 years maturity] CFs (Bond) = Annuity + Par • The equilibrium price of the bond = the PV of the CF’s from the bond
The cash flows of the bond issued by ABC co. 0 1 2 . . . . 10 $90 P ? $90 $90 + $1,000 yield = 7% (0.07) 1.2 Example - bond valuation Example 1: ABC Company issued a 10-year $1,000 bond. Interest payments of $90 are made at the end of each year and the $1,000 principal will be paid at the end of the tenth year. If the yield on a comparable bond is 7%, what will be the price of the bond? Calculator: i) Set P/Y = 1 using the key combination:2nd, P/Y, 1, ENTER , 2nd, QUIT ii) Enter the data:2nd, CLR TVM, 10, N, 7, I/Y, 90, PMT, 1000, FV, CPT, PV - 1,140.47will be displayed
1.3 PV(Bond) = PV (Coupons) + PV (Final Payment) • EXAMPLE: Consider a 10 year bond with 7% coupon rate and $10,000 face value. The discount rate, Yield-to-maturity, is 5.5% • PV(coupon payments) is the PV of an annuity
1.4 After Bond Is Issued, InterestRates On Similar BondsChange But Cash Flows From Bond Stay Same • Capital Gains/Losses : Price of bond will vary because the price is the PV of the remaining cash flows • Discount rates change with changes in yield to maturity (YTM) or yield on similar bonds! • EXAMPLE: If the bond in the last example is sold one year later at YTM = 5%, what is the holding period (one year) return? ANS: The bond price with 9 year maturity, 7% coupon, 5% YTM should be: PSALE = $11,421.56 Dollar Return = (PSALE - PPURCHSE )+ Coupon = 11,421.56 - 11,130.65 + 700 = 990.91 Rate of Return = (Dollar Return)/ PPURCHSE = 990.91/ 11,130.65 = 8.90%
1.5 Yield-To-Maturity (YTM) • Calculate YTM,r, for a 5-year, 7% coupon bond priced at 102.50 • Find the value of r that satisfies the equation: IRR calculation R is the yield to maturity (YTM) or yield We assume a flat term structure of interest rates R = 6.40% using calculator
1.6 Interest Rate Risk • When market interest rates rise, bond prices fall: Capital Loss • When market interest rates fall, bond prices rise: Capital Gain • Bond price is more sensitive to changes in interest rates • the longer current maturity • the lower the coupon rate • EXAMPLE is more sensitive to changes in R than
1.7 Bonds with Semi-annual Coupon Payments • The semiannual coupon rate is half the annual coupon rate. • Bond yield is quoted as twice the semiannual bond yield • For a 10 year 7% coupon bond with $1,000 face value, semiannual coupon is $35. C = Annual coupon r = YTM (annualized) Maturity n = Maturity In Calculator: Set P/Y=2 r I/Y C/2 PMT Face Value FV 2 x # Yr N - Price PV
1.8 Bond Market Quotes (Dealer Quotes) BidPrice = (112+ 25/32) % = 112.7813% of Face Value AskedPrice = (112+ 29/32) % = 112.9063% of Face Value Change of bid price from the previous market day. The bid price on Tue, Jan 19 was 112:25 + 0:09 = 113:02 Quote date=1/20/99 settlement date = 1/21/99, one market day later Yield (Yield-to-maturity) based on the AskedPrice = 4.92% Coupon Rate = 7% / year Maturity = 7/15/06, n = note Calculate Yield:Treasury Notes/Bonds: Coupons are paid semi-annually. 2nd, Bond, 2nd, CLR Work, SettlementDate 1/21/991.2199,ENTER,x, Coupon7,ENTER, x, RedemptionDate 7/15/067.1506, ENTER, Redemption Value (Face Value): leave at 100,x, day count set atACT, not360, x, set compounding frequency at semi-annual 2/Y, x, skip YLD,,x, price112+(29/32) =, ENTER, w, compute yield CPT, YLD = 4.92 will be displayed, same as shown in the last column on the WSJ.,x,xshows accrued interestAI = 0.12. The total price is (the price quoted, 112+29/32) plus (the accrued interest, 0.12). To compute the price given yield, enter the yield and go to PRI and CPT.
2. Stock Valuation • Why do we need a theory of the valuation of common stocks? • Managers should be making decisions which increase share price • Need to understand how share price is determined • When stock price can not be observed directly: • How to value a division of a company • Privately held firm for possible sale • What determines stock price? • BOOK VALUE • Amount a company has paid for its assets • Allowance for depreciation but no allowance for inflation. • LIQUIDATION VALUE • What the company could realize by selling its assets and repaying debts. • Ignores: the value of a going concern • Ignores intangible assets, (patents, brand name) • Ignores future profitability • MARKET VALUE • The amount that investors are willing to pay for the firm. • Depends on the earning power of existing assets and the future profitability
2.1 Stock Valuation : PV vs. Price • PV is used in stock valuation. Why?: At equilibrium YPV = Price Example 2: Consider ABC Toy Co. The company starts its operation in year 2000 and its year-end revenues and costs are given below. Profits are distributed as dividend each year. All cash flows occur with certainty. At the end of the year 2003, the company will be liquidated. There are 1,000 shares of ABC stocks. What is the price of a share of ABC at the end of the year 2000? Assume the discount rate is 15%.
2.1 PV vs. Price - continued Answer: The value of the firm = SUM of all PV’s of dividends = $3,398,093 Therefore, PV of one share = $ 3,398,093) 1,000 shares = $3,398.09 • If the market price of one share is $3,000, one can borrow $3,398 and buy the stock and earn a profit equal to $398.09. This will drive up the market price. • If the market price is $4,000, then anyone who owns the stock should sell them. This will give them $4,000 compared to $3,398.09 from dividends in year 2000 money. This will drive down the market price. • Therefore, in equilibrium, Price = PV
2.2. Perpetuity - Annuity with no maturity • Perpetuity: An infinite stream of payments • a useful concept in valuing stocks with constant dividends Example 3:(Present Value of a perpetuity) Find the PV of a stream of $1,000/year forever. Assume an interest of 10%. Deposit $10,000 at a bank at 10% = Receive $1,000/year forever.
2.3. Perpetuity - Formula • Present Value of a perpetuity with a payment stream $ C:
2.4. Growing Perpetuity • Growing Perpetuity: a perpetuity with the payments growing at a rate of “g” per period instead of being constant through time Through a similar approach to the perpetuity, the PV formula for g < r can be obtained as: Example 4: Find the PV of a stream of payments with the first payment = $1,000 and growing at 3% per year forever. Assume an interest of 10%. Deposit $14,285.71 at a bank at 10% = Receive $1,000 one year later, $1,000(1+0.03) in year 2, $1,000(1+0.03)2 in year 3, and so on forever.
2.4a. Growing Annuity • Growing Annuity: an annuity with the payments growing at a rate of “g” per period for N-periods. • The PV formula can be solved as an equivalent annuity problem with the adjusted payment = CF1/(1+g) and the adjusted discount rate k= (1+r)/(1+g) - 1:
2.4b. Growing Annuity - Example Example 5: Find the PV of a stream of ten payments with the first payment = $1,000 and growing at 3% each subsequent year. Assume an interest of 10%. ANS: This is a growing annuity problem. We need to calculate the adjusted discount rate k: k = (1+r)/(1+g) - 1 = 1.1/1.03 -1 = 0.068 (6.80%) Therefore the equivalent annuity problem is: Adjusted annual payment = C1/(1+g) = 1000/1.03 = 970.87 Adjusted discount rate = 6.80% Using the calculator: N =10, PMT = 970.87, I/Y=6.8 Compute the PV --> You should get: PV = 6,953.36 (The accurate number w/o rounding errors = 6,883.74) You can also compute the future value: N =10, PMT = 970.87, I/Y=6.8 Compute the FV --> You should get: FV = 13,287.93 (The accurate number w/o rounding errors = 13,285.54)
DEALER MARKETS No central location Network connected by computer OTC markets Dealers buy and sell securities Stocks and debt securities NASDAQ 2.5 Types of Security Markets • AUCTION MARKETS • Physical location • - Wall street • Primarily matching buyers and sellers • - Specialist role • Shares of most large firms trade in auction markets • -NYSE, ASE
Stock Markets: NYSE Quotesfrom Wall Street Journal 2/18/99 Quote date=2/17/99 Dividend Yield 0.5% P/E Ratio Trading volume 44,885 x 100 shares traded Dividend $ 0.88 Highest price during the day $174.3125/share Stock Symbol Lowest price during the day $168.8125/share Company name Closing trade price $170.50/share During the past 52 week Highest price = $199.25/share Lowest price = $ 95.875/share 2.5a Stock Market Data
2.6 Motivation on Stock Pricing Motivation 1: Stock market data for ABC and XYZ are as follows: XYZ stock seems a better investment than ABC because, for every $100 invested, XYZ has (i) a higher rate of dividend payment, and (ii) a higher rate of earnings. Do you agree?
3. Stock Price and Dividends Cash flows to stock owner is in two forms: (1) Cash dividends paid to stock holders (2) Capital gains or losses Thus the price of stock is the sum of (PV of all dividends during the holding period) and (PV of the stock price at the end of the holding period) The cash flows to stocks held for H periods 0 1 2 . . . . H-1 H DivH-1 P0 Div1 Div2 DivH+PH Expected yield = r
3.1 Constant Dividend • Common stocks have no maturity. (The price of a share) = PV (all future dividends) • Special Case 1: Constant dividends DIV1=DIV2=.......=DIV This is just an ordinary perpetuity. Therefore, the price of a share is: Example 5: If XYZ Co. is expected to pay out dividends at $2 per year, what is the price of the stock assuming the discount rate is 10%. ANS: P0 = $2 / 0.1 = $20
3.2. Growing Dividend • Special Case 2: Gordon Model Dividends expected to grow at constant rate DIVt = DIV0 (1+g) t , t = 1 - 4 This is just a growing perpetuity. Therefore, the price of a share is: D1 Example 6 (Super Normal Growth): The dividends for ABC stock are: DIV1 = $5, growing at g1=25%/year for three years and at g2 = 4% thereafter. The discount rate is r=12%. What is the price at t=0, P0?
3.3 Dividend Yield and Stock Price • Dividend Yield = (Annual Dividend) divided by (Share Price) • A stock with a lower dividend yield does not necessarily imply that the stock is overpriced. • Dividend yield is based on one period dividend while share price is the PV of ALL dividends. Example 7: Company A expects dividends $2 next year growing at 10% per year in subsequent years and the discount rate is 15%. Company B expects dividends $4 next year growing at 5% per year in subsequent years and the discount rate is 15%. What are the stock prices for A and B? Ans:Apply Gordon Model PA = 2/(0.15 - 0.10) = $40 PB = 4/(0.15 - 0.05) = $40 Both A and B are priced at the same $40 per share even though they have different dividend yields: 5% for A and 10% for B ! • Look back the motivation example 1 and evaluate the argument.
3.4 Plowback Ratio and Dividend Growth Rate • DividendGrowthRate = PlowBackRatio x ROE • Assuming ROE constant • WHY? • Example: Assume for XYZ company: ROE = EPS/BookEquityPerShare = 12.5% and remains constant 70% of EPS paid out as dividend 30% of EPS is plowed back into book equity [plowback ratio] Then, what is the equity growth rate? EquityGrowthRate= ChangeInEquity / BookEquityPerShare =(0.3 x EPS)/BookEquityPerShare = 0.3 x EPS/ BookEquityPerShar = 0.3 x 0.125 =3.75%[=PlowbackRatio x ROE] Since ROE [= EPS/BookEquity] is constant, EPS (and dividend) Growth Rate = EquityGrowthRate = 3.75% ROE
3.5 Formula for g, ROE, and Plowback Ratio • Dividend Growth Rate:g = Plowback Ratio x ROE • Proof: • Plowback Ratio: b = 1 - Payout Ratio = 1 - DIV/EPS • Return On Equity: ROE = EPS/BookEquityPerShare ChangeInEquity = b x EPS EquityGrowthRate = ChangeInEquity / BookEquityPerShare = b x EPS/BookEquityPerShare = b x ROE If ROE is constant, then GrowthRate(EPS)=GrowthRate(BookEquityPerShare) because EPS= ROE x BookEquityPerShare That is, EPS and dividends grow at the same rate as book equity Therefore g = b x ROE Also g can be expressed as: $ invested back into equity: Retained Earning
3.6 Example: Plowback Ratio and Dividend Growth Rate • Given the following data for XYZ company: Plowback Ratio 40% ROE 12% DIV1 $1.20 P0 $48 • What should be the DIVIDEND GROWTH RATE? g = (Plowback Ratio) x ROE = 0.4 x 0.12 = .048 (4.8%) • What should be the DISCOUNT RATE for XYZ stock?
4. Market Capitalization Rate, Discount Rate • Market Capitalization Rate (MCR) • the discount rate at which the PV of all dividends equal the current market price of the stock: StockPrice = PV(ExpectedFutureDividends) at MCR • similar to the bond yield • expected return: Average of possible returns weighted by their probabilities • All securities in an equivalent risk class are priced to offer the same expected return. • Example: Find the market capitalization rate for a stock priced at $40. The dividend next year is expected $1.50 per share and the dividends are expected to grow at 12% per year forever. • Opportunity Cost of Capital, hurdle rate, cost of capital: expected return that is forgone by investing in a project rather than in comparable financial securities.
5. Stock Price, EPS and NPVGO • EarningsPerShare (EPS) = Dividends + RetainedEarnings • P/E Ratio = StockPrice / EPS • Is a lower P/E ratio stock a better buy than a higher P/E ratio stock? • Not always. Need to consider the growth opportunity • Why does anyone buy a stock with a negative EPS? • What is the difference between • Income Stock and • Growth Stock
The Cash Flows of a Static Firm 0 1 2 3 4 . . . P0 EPS EPS EPS EPS 5.1 Constant EPS - A Static Firm • Firm A is a mature firm. • It expects constant EPS = $10 and pays out all its earnings as dividend. • Zero retained earnings • Constant EPSY The stock price can be calculated using the constant dividend model. • Assuming r = 16%, PA = 10/0.16 = $62.50
5.2 A Growth Firm Example 8: Firm B is exactly same as Firm A except it reinvests its first year earnings into a new project. The new project will earn $4 per year per share forever. Firm B will pay out all its earnings as dividends starting in the year 2. The Cash Flows of Firm B 0 1 2 3 4 . . . P0 Z CF’s of the existing operation $10 $10 $10 $10 $4 - $10 Z CF’s of a new project $4 $4 Z Dividends 0 $14 $14 $14 PV at t=1 PV at t=1 • The PV of all dividends = (14 / 0.16) / 1.16 = $75.43 • The stock price can also be calculated as the sum of the PV of EPS of the existing operation: 10 / 0.16 = $62.50 the Net PV of CF’s of the new project: (-10 + 4/0.16) / 1.16 = $12.93 Total = $75.43 • The stock B is $12.93 more than the stock A, an amount representing the NetPresent Value of the Growth Opportunity (NPVGO or PVGO)
5.3 NPVGO and Stock Price • Using symbols, the firm B’s cash flows are as follows: The Cash Flows of Firm B 0 1 2 3 4 . . . P0 Z CF’s of the existing operation EPS EPS EPS EPS - EPS EPSN2 Z CF’s of a new project EPSN4 EPSN3 EPS + EPSN2 EPS + EPSN4 EPS + EPSN3 0 Z Dividends • The stock price is then the sum of ( EPS / r ), the PV of EPS of the existing operation, AND (NPVGO), the Net PV of CF’s of the new project Eq (1)
5.4 P/E Ratio • Dividing through by EPS the relationship between stock price, EPS, and NPVGO (Eq 1), we get the P/E ratio: • P/E Ratio: • Overestimate (1/r) by (NPVGO/EPS) • High P/E ratio stock is not necessarily a bad buy. It depends upon both NPVGO and the market capitalization rate. • Motivation Example 1: ABC company has a higher P/E ratio than XYZ Co. They both have the same market capitalization rate. Is ABC a bad buy? Not necessarily. The higher P/E ratio for ABC may be due to ABC having more growth opportunities. • low P/E ratio stock: most likely income stock, such as public utility companies • high P/E ratio stock: most likely growth stock such as Amazon.com • EPS is an accounting (or book) figure • mean different things for different firms • different accounting procedures produce different EPS. • Examples: depreciation methods, inventory valuation methods, ...
6. Valuing A Firm • Total value of a firm’s common stock: discounted value of Free Cash Flows(=Earnings – Net Investment) paid on existing stock. (PV of Free Cash Flows out to a valuation horizon, H ) plus ( PV of the value of the business at the horizon, PH ) • Valuation Horizon (H) • Horizon may be time at which Long Run Competitive Equilibrium is expected to be established in the industry. • Assumptions at the time horizon: NPVGO = 0or Long Run growth rate = constant • Value of the firm can be sensitive to small changes in assumptions, like long term growth rate.
6.1 Calculating Horizon Value,PH: Three Ways • Present Value Approach • P/E Ratio Approach PH= EPSH x (P/E Ratio observed in the market for similar mature companies) • Market-To-Book Ratio Approach PH= (Estimated Horizon Book Value Of Firm) times (Market-To-Book Ratio Observed In The Market For Similar Mature Companies)
6.3 Valuing P&Z Manufacturing What should be the value of the P&Z Manufacturing at the end of the year 0? • Assumptions: • Long-run growth rate: 6.5%; Discount rate: 10%; • P/E ratio of mature comparable companies = 15; • Market-To-Book Ratio of mature comparable companies = 1.9 • P0 = PV(Free CFs for years 1 -6) + PV(P6) PV(Free CFs for years 1-6) = - $13.58 million PVH = PV (P6) = 5.08/(0.10-0.065)/(1.1)6 = $81.93 (constant growth div model) PVH = PV (P6) = 15 x 10.16/(1.1)6 = $86.03 (P/E model) PVH = PV (P6) = 1.9 x 67.97/(1.1)6 = $72.90 (market-book ratio model) • PV(business) = PV(Free CFs) + PV(horizon value) -13.58 + 81.93 = $68.35 million (constant growth dividend model) or -13.58 + 86.03 = $72.45 million (P/E model); or -13.58 + 72.90 = $59.32 million (market-book ratio model)