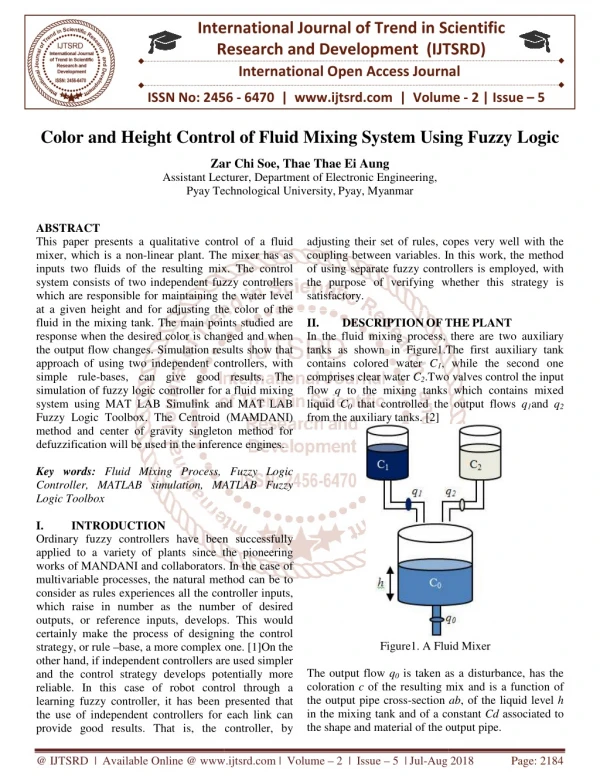
Download
1 / 29
290 likes | 436 Vues
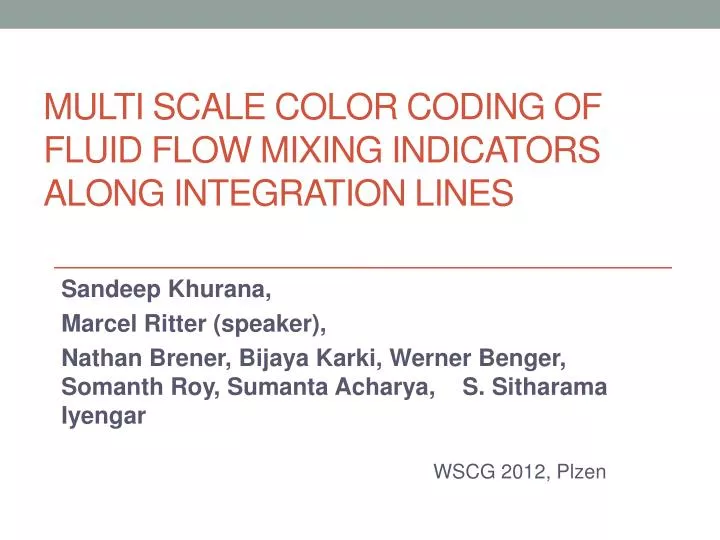
Multi scale Color Coding Of Fluid Flow Mixing Indicators Along Integration Lines. Sandeep Khurana , Marcel Ritter (speaker), Nathan Brener , Bijaya Karki , Werner Benger , Somanth Roy, Sumanta Acharya , S. Sitharama Iyengar. WSCG 2012, Plzen. Outline. Motivation

E N D
Multi scale Color Coding Of Fluid Flow Mixing Indicators Along Integration Lines SandeepKhurana, Marcel Ritter (speaker), Nathan Brener, BijayaKarki, Werner Benger, Somanth Roy, SumantaAcharya, S. SitharamaIyengar WSCG 2012, Plzen
Outline • Motivation • CFD Simulation Dataset • Computation • Multi Scale Color Coding Approach • Rendering • Results
Outline • Motivation • CFD Simulation Dataset • Computation • Multi Scale Color Coding Approach • Rendering • Results
Motivation • Simulation generates scalar data which is essential to understand the phenomenon in the system • Visualize data with large variations, give local and global knowledge at the same time • Small variations - clearly distinguishable • Better understanding of the data [Kindlmann1998]
Outline • Motivation • CFD Simulation Dataset • Computation • Multi Scale Color Coding Approach • Rendering • Results
CFD Simulation Dataset • Stirred tank reactors are used in many industries to mix chemicals • Understanding the fluid dynamics is critical for product yield • The simulation under study has two reagents being mixed using an impeller with blades pitched at 45-degree angle
CFD Simulation Dataset Specifications: • Multi block (2088 blocks) curvilinear grid • Has about 3.1 million cells, 5700 timesteps • File size: originally 500 GB, optimized 280 GB (removed duplication of position field at every timestep) • Fields available • Position • Velocity • Pressure
Outline • Motivation • CFD Simulation Dataset • Computation • Multi Scale Color Coding Approach • Rendering • Results
Computation Pathlines: Also known as characteristic lines, a technique that is used to visualize advection of massless particles along the flow of the vector field. Particle traces or pathlinesare computed in order to determine the locations of a particle previously represented as a bubble Example showing a pathlineand particle velocity
Computation • Seeding points - 516 • Two spheres inside the stirred tank • Represent fluid particles
Computation • Non trivial task – Find which cell contain particle (for interpolation) • Why? Curvilinear multiblock grid • Used a KDTree and an uniform grid look up structure to find candidate curvilinear grid cells • Velocity interpolated using a direct trilinear interpolation using world coordinates • It decides if a point is located inside a cell by evaluating the plane equations for each face of the cell
Computation • Also involves derived quantities computation • Quantities we computed were • Curvature • Torsion • Specific measure of length generation • To compute these quantities we computed • Acceleration (first derivative of velocity) • Jerk (second derivative of velocity) • Higher order differentiation formulas were used that employ 5 points rather than 3 points in the central, forward and backward difference formulas
Computation Definition of curve: In differential geometry, a curve q is a function that maps a real-valued parameter s to a point q(s) within a differential manifold M. Variation of the curve parameter s defines the tangential vector along the curve.
Computation • Derived quantities of a curve: • Curvature with derivatives: • Torsion • Specific measure of length generation [Ottino]where λ = δ/L , δ being the increase in path length (which is proportional to the magnitude of the velocity) and L being the total path length (before the d increment) at a particular time t.
Outline • Motivation • CFD Simulation Dataset • Computation • Multi Scale Color Coding Approach • Rendering • Results
Multi Scale Color Coding • To visualize the entire range of scalar field values including small, medium and large values • Uniform color coding often gives a single predominant color • Multi scale color coding helps to give smallas well as large variations at the same time
Multi Scale Color Coding • Our approach: Histogram based scalar value extraction • Creating a number of bins, each representing a range of scalar values • Parameters for multi scale • Number of divisions • Scalar values for each scale • Colors to map them
Outline • Motivation • CFD Simulation Dataset • Computation • Multi Scale Color Coding Approach • Rendering • Results
Rendering • ‘Illuminated Streamlines’ method [Zockler] • Rendering is fast and interactive • A realistic visualization by incorporating depth perception • Phong lighting model is used • Intensity is defined as where L denotes the light direction, V the viewing direction and R the unit reflection vector (the vector in the L-N-plane)
Rendering • But for lines the unique normals and reflection vectors are undefined. So, intensity can be made dependent on the tangential vector T instead as
Outline • Motivation • CFD Simulation Dataset • Computation • Multi Scale Color Coding Approach • Rendering • Results
Results Comparison of uniform(left) and multi scale(right) color coding for the length generation mixing indicator
Results Comparison of uniform(left) and multi scale(right) color coding for the curvature values
Results Comparison of uniform(left) and multi scale(right) color coding for the torsion values
Results Also FrenetRibbons [FrenetRibbon2010] were used to geometrically see the particle trace, they: • geometrically encode curvature and torsion • provide one more degree of freedom to the geometry i.e. surface • Added multi scale color coding on torsion values
Results • Areas with a lot of twist correlate to high torsion whereas the areas which seems consistently straight might have different colors due to change in their torsion values.
Thank You • Sandeep Khurana [1] • Nathan Brener [1] • BijayaKarki [1] • Werner Benger [2,3] • Somanth Roy [4] • SumantaAcharya [5] • Marcel Ritter [6] • S. SitharamaIyengar [7] [1] Department of Computer Science, Louisiana State University, USA [2] Center for Computation & Technology, Louisiana State University, USA [3] Institute for Astroand Particle Physics, University of Innsbruck, Austria [4] Dept. of Mechanical Engineering, Indian Institute of Technology, India [5] Dept. of Mechanical Engineering, Louisiana State University, USA [6] Inst. of Basic Sciences in Civil Engineering, University of Innsbruck, Austria [7] School of Computing & Info. Sciences, Florida International University, USA