Download
1 / 18
220 likes | 432 Vues
Iron Isotopes 11/ 15/ 12. Banded iron formation, 2.1Ga. Lecture outline: the basics abiotic and biotic fractionations in modern-day environments Fe isotopes in the geologic record. Closeup of BIF. The basics. Fe oxidation states :

E N D
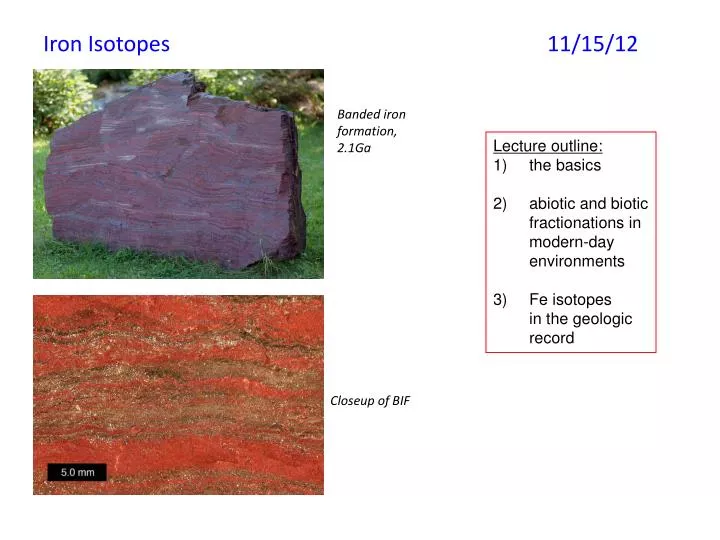
Iron Isotopes 11/15/12 Banded iron formation, 2.1Ga • Lecture outline: • the basics • abiotic and biotic • fractionations in • modern-day • environments • Fe isotopes • in the geologic • record Closeup of BIF
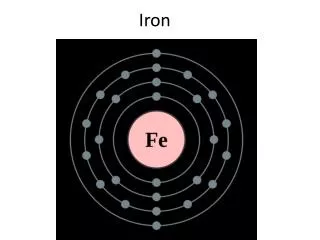
The basics Fe oxidation states: +3 (“ferric”, insoluble, hematite Fe2O3) +2 (“ferrous”, soluble, pyrite FeS2) both (magnetite, Fe3O4) Rt in ocean is 3-5yrs Possibly radioactive with t1/2 = 3.1 x 10²¹yrs Standard is the average composition of igneous rocks (Beard et al., 1999): 54Fe/56Fe = 0.063683 57Fe/56Fe = 0.023087 58Fe/56Fe = 0.0030614
A word on measuring Fe isotopes Resolution: R=m/Dm quad ICPMS = 1 HR-ICPMS = up to 8,000 ±0.02-0.04‰ (2s) measured by isotope dilution (Johnson & Beard, 1999 on TIMS, Millet et al., 2012 on MC-ICPMS) ±0.04-0.1‰ (2s) measured as natural ratios (John & Adkins, 2010 on MC-ICPMS) Millet et al., 2012 Analyte Interference |Δ m| m R 52Cr = 52.94065 37Cl16O = 52.96081 0.02016 53 2629 56Fe = 55.93494 40Ar16O = 55.95729 0.02235 56 2505 40Ca = 39.96259 40Ar = 39.96238 0.00021 40 190476
Natural range is ±2-3‰ Beard and Johnson, 2004
Rule of thumb: Ferric-bearing phases higher d56Fe than ferrous-bearing phases. Except pyrite, which has highest d56Fe. 3+ Beard and Johnson, 2004
Experimentally-derived equilibrium fractionations: temperature-dependent No effect from [Cl] consistent between experiments small fractionations (2-3‰) modified by Beard and Johnson, 2004 from Welch et al., 2003
modified by Beard and Johnson, 2004 from Shuklan et al., 2002 Relatively large kinetic fractionations: these data can be modeled as a Raleigh distillation process with D56FeFeIII-Hem = +1.3‰ but equilibrium inferred value is D56FeFeIII-Hem = -0.14‰
Low-T environments • Some observations: • surficial processes that occur under • oxic conditions do not change d56Fe • in order to see d56Fe changes, you need • to mobilize Fe, make different pools • in anoxic environments, redox cycling • of Fe results in large fractionations • (via bacterial Fe reduction or interaction • with H2S) Precipitation of sulfide minerals shift d56Fe of residual vent fluids? Beard and Johnson, 2004
Sources of Fe to the modern oceans Beard et al., 2003a
This model is confirmed by observed Fe isotope anomalies in Fe-Mn nodules from modern oceans Beard et al., 2003a
4 processes reflected in distribution of Fe isotopes in fluids: transport of dissolved or colloidal Fe in rivers oxidation of Fe2+ isotopic exchange with reactive S during BSR dissimilatory Fe reduction (DIR) Johnson et al., 2008
main point: Biotic and abiotic fractionations overlap but DIR is contributing the largest, lowest d56Fe pool Johnson et al., 2008
Fe isotopes in the ancient rock record BIFs and associated d56Fe anomalies signal presence of large Fe3+ and Fe2+ pools simultaneously; explained by episodic O2 increases followed by return to low-O2 conditions? Johnson et al., 2008
Coupling between Fe,S, and C isotopes Johnson et al., 2008
Putting it all together… grey bar = rise of methanogenesis? (low d13C) GOE = more SO42- more BSR? Johnson et al., 2008
grey bar = GOE event stops MIF signa transport to sediments DIR increases as O2 increases, more Fe3+ available Johnson et al., 2008
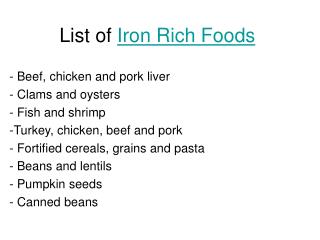
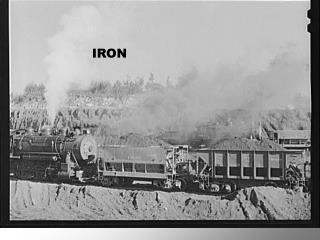
Christmas Creek Iron mine, Australia produces 6-7Mt per year of Fe ore!