Download
1 / 11
130 likes | 578 Vues
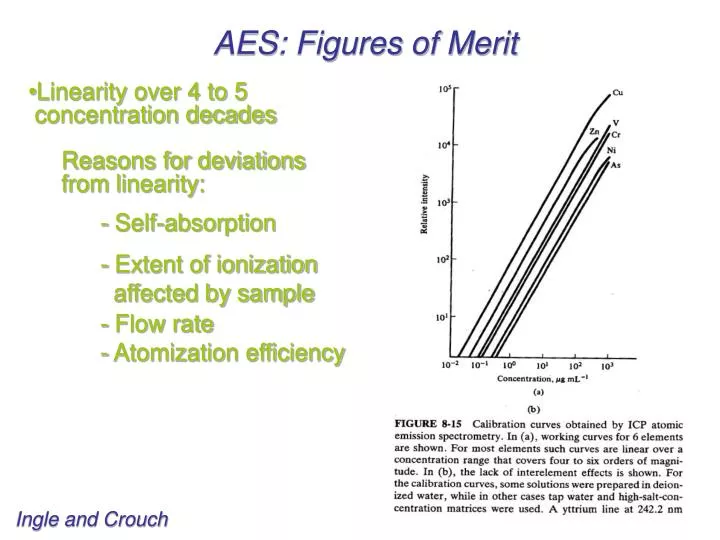
AES: Figures of Merit. Linearity over 4 to 5 concentration decades Reasons for deviations from linearity: - Self-absorption - Extent of ionization affected by sample - Flow rate - Atomization efficiency. Ingle and Crouch. AES: Figures of Merit.

E N D
AES: Figures of Merit • Linearity over 4 to 5 • concentration decades • Reasons for deviations • from linearity: • - Self-absorption • - Extent of ionization • affected by sample • - Flow rate • - Atomization efficiency Ingle and Crouch
AES: Figures of Merit • Linearity over 4 to 5 concentration decades • Precision: Typically a few % (lower in calibration solutions) • Limited by stability of source and random electrical noise • Accuracy: An optimized spectrometer should be capable of precision-limited accuracy • Limited in ICP AES by spectral overlap • Applicability: 3/4 of all elements (ICP) • Limitations in detection limits: * Major transitions in UV • * Temperature too high for alkali metals (ion emission in UV as they have fully occupied electron shells)
Detection Limits for Flame AES Ingle and Crouch, Spectrochemical Analysis
Detection Limits for ICP AES Ingle and Crouch, Spectrochemical Analysis
AES: Instrumental Aspects 5. 6. 4. 3. 2. Ingle and Crouch, Spectrochemical Analysis 1.
Atomic Absorption Spectroscopy (AAS) See also: Fundamental reviews in Analytical Chemistry e.g. Bings, N. H.; Bogaerts, A.; Broekaert, J. A. C. Anal. Chem.2002, 74, 2691-2712 (“Atomic Spectroscopy”) • 1802 Wollaston observes absorption lines in solar spectrum • 1914 Hollow cathode lamp • 1955 Walsh describes analytical AAS • 1959 1st Commercial Flame AAS • 1960s L’vov and Massman describe graphite furnace (commercial in 1970s) Recall: A = -log10(T)
Hollow Cathode Lamp • Typical primary source of radiation: Hollow cathode lamp • * Typically one lamp per element • * Different intensities for different elements • * Multielement lamps for multielement analysis • Continuum sources (e.g. Xe arc lamp) only for multielement analysis Kellner et al., Analytical Chemistry
Flame AAS At <5000 K most atoms are predominantly in their electronic ground state. Slot burners with 5-10 cm path lengths. Kellner et al., Analytical Chemistry Ingle and Crouch, Spectrochemical Analysis
Electrothermal Atomization • Heating current of several hundred A • Heating rates of up to 1000 °C/s • LOD 100 times lower than flame AAS Heated in three stages: Ingle and Crouch, Spectrochemical Analysis
Electrothermal Atomization • Typical furnace material: Graphite • Graphite Furnace AAS • Graphite tube 18-28 mm • Samples 5-100 uL • 200 to 1000 cycles • Temperature up to 3000 °C to avoid graphite decomposition • Carbon may be reducing agent for metal ions • Argon flow avoids oxidation • Other furnace materials: Ta, W, Pt • High melting point required • Should not emit brightly at high temperature (disadvantage for W and Ta)
Are you getting the concept? Is ICP a good source for AAS?