Download
1 / 53
530 likes | 648 Vues
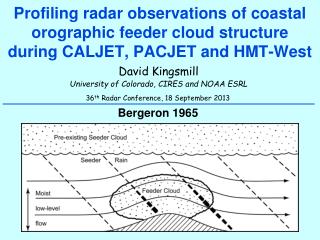
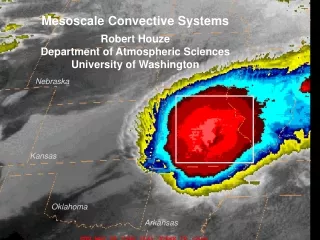
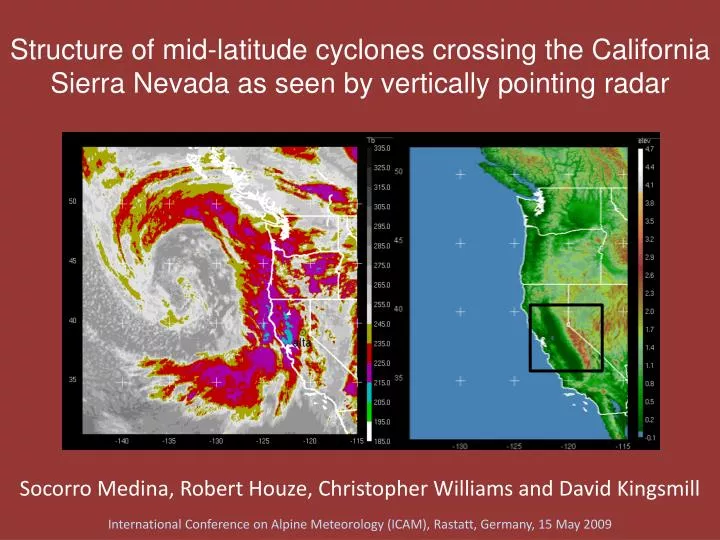
Structure of mid-latitude cyclones crossing the California Sierra Nevada as seen by vertically pointing radar. Socorro Medina, Robert Houze, Christopher Williams and David Kingsmill. International Conference on Alpine Meteorology (ICAM), Rastatt , Germany, 15 May 2009.

E N D
Structure of mid-latitude cyclones crossing the California Sierra Nevada as seen by vertically pointing radar Socorro Medina, Robert Houze, Christopher Williams and David Kingsmill International Conference on Alpine Meteorology (ICAM), Rastatt, Germany, 15 May 2009
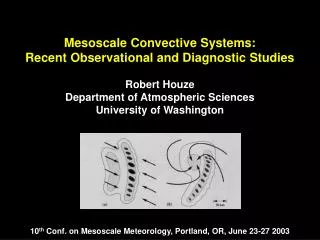
Previous studies of extratropical cyclone passage over complex terrain Alps (MAP) Cascades (IMPROVE-2) NOAA vertically pointing (VP) radar ETH vertically pointing (VP) radar
REFLECTIVITY (dBZ) REFLECTIVITY (dBZ) Alps VP radar data Cascades VP radar data 09:00 08:00 01:00 00:00 Time (19991021) Time (20011214) RADIAL VELOCITY (m s-1) RADIAL VELOCITY (m s-1) OBSERVATIONS IN MIDDLE SECTOR OF STORM, IN STATICALLY STABLE LAYER WITH STRONG VERTICAL SHEAR TURBULENCE 09:00 08:00 01:00 00:00 Time (19991021) Time (20011214)
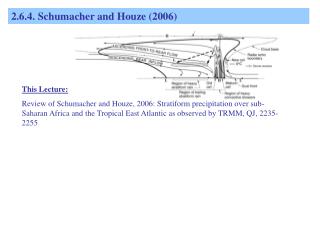
Conceptual model of dynamical and microphysical mechanisms active when the middle sector of extratropical cyclone passes over a windward slope Updrafts ~1-3 m/s Cell width ~1-5 km Houze and Medina 2005
Objectives • Extend the studies of extratropical cyclone passage over complex terrain to California’s Sierra Nevada • Inquire about repeatability of overturning, turbulent cells • Seek a deeper understanding of this mechanism
Dataset • From the HydrometeorologicalTestbed that the US National Oceanic and Atmospheric Administration (NOAA) has been conducting in the Sierra Nevada (Ralph et al. 2005) • Expands over three winter seasons (2005/06, 2006/07, and 2007/08) • Main dataset from the vertically pointing (VP) S-band radar located at ‘Alta’ • Complemented by GOES, North American Regional Reanalysis (NARR), soundings and weather surveillance radar data
Analysis of the Alta VP dataset We find all the time periods that have stratiform precipitation that is deep (reflectivity > 0 dBZ from surface to 4 km height) and long lasting (> 2 hours) 57 “events” are found Time (4 Jan 2008)
Analysis of the Alta VP dataset We find all the time periods that have stratiform precipitation that is deep (reflectivity > 0 dBZ from surface to 4 km height) and long lasting (> 2 hours) 57 “events” are found We investigate the upward motions for these events
VP Alta data for 04 Jan 2008 Estimate of upward motions using perturbation radial velocity Reflectivity (Z = [dBZ]) Radial Velocity [m/s] 1 hr running mean radial velocity [m/s] Perturbation radial velocity [m/s]
Analysis of the Alta VP dataset We find all the time periods that have stratiform precipitation that is deep (reflectivity > 0 dBZ from surface to 4 km height) and long lasting (> 2 hours) 57 “events” are found We investigate the upward motions for these events These calculations indicate that ~10 (out of a total of 57 events) have clearly defined, intermittent up and downdrafts, similar to what was seen in the Oregon Cascades and the Alps
Analysis of the Alta VP dataset We find all the time periods that have stratiform precipitation that is deep (reflectivity > 0 dBZ from surface to 4 km height) and long lasting (> 2 hours) 57 “events” are found We investigate the upward motions for these events These calculations indicate that ~10 (out of a total of 57 events) have clearly defined, intermittent up and downdrafts, similar to what was seen in the Oregon Cascades and the Alps Example of 4 Jan 2008 (case shown before)
Synoptic setting of 4 Jan 2008 caseInfrared satellite temperature (~15 UTC)
Synoptic setting of 4 Jan 2008 case 850 mb temperature – (15 UTC) NARR
Conclusions • Intermittent cells were clearly defined in at least ~17% of the deep, long lasting stratiform events in the Sierra Nevada • Case study analysis suggest that the updrafts occur as the middle sector of the storm passes over the windward slopes, in a statically stable layer and in a region of strong vertically shear i.e., similarly to what was observed in other mountain ranges FUTURE STEP: Analyze the distribution of updraft magnitude in relationship to shear, static stability, precipitation, etc
VP Alta data for 04 Jan 2008 Estimate of upward motions using perturbation radial velocity Perturbation radial velocity [m/s]
Aircraft observations across the Snowy Range, Wyoming Geerts et al. 2008
Aircraft observations across the Snowy Range, Wyoming Geerts et al. 2008
Precipitation pattern typical of maritime cyclones moving toward US west coast Nagle and Serebreny 1962
Farber (1972) found a pronounced orographic effect in the middle sector: “pockets of moisture are observed in liquid water content meter” “There are pockets of excessively high crystal concentration which appear to be directly proportional to the amount of turbulence in the region” “turbulence near the surface, originating from local topographical features as well as strong vertical wind shears” Houze and Medina (2005)
Results from Farber (1972) and Hobbs (1975): Aircraft study of mid-latitude cyclones over the WA Cascades LATE (Post-frontal) EARLY (Pre-frontal) MIDDLE (Transitional) Instability increases Cloud tops decrease Ice crystals decrease LWC: low high moderate # Aggregates: moderate & constant variability, locally high low Turbulence: low high high
Upstream stability profiles for storms with shear layer STABLE UNSTABLE
Richardson number (Ri) for storms with shear layer Ri = Nm2 / [dU/dz]2
Shear layer m s-1 Case 11 m s-1 E RADAR E W
VP Alta data for 04 Jan 2008 Estimate of upward motions by subtractingfallspeed Reflectivity (Z = [dBZ]) Radial Velocity [m/s] Fallspeed of snow [m/s] = 0.817 Z 0.063 (Atlas et al. 1973) Vertical motion [m/s]
Radial velocity – 15 UTC 04 Jan 2008 (KDAX) m s-1 -30.9 -18.0 -7.7 -0.5 0.0 7.7 18.0 30.9 2.4 deg elevation scan, 25 km rings
0700 UTC 03 Jan – 2020 UTC 04 Jan 2008 Accumulated precipitation KDAX (50 km rings)
Synoptic setting of 4 Jan 2008 case 500 mb geopotential height – (15 UTC) NARR
Synoptic setting of 4 Jan 2008 case900 mb specific humidity (NARR)
Synoptic setting of 4 Jan 2008 case 850 mb temperature (NARR)