Download

1 / 22
220 likes | 225 Vues
This presentation will probably involve audience discussion, which will create action items. Use PowerPoint to keep track of these action items during your presentation In Slide Show, click on the right mouse button Select “Meeting Minder” Select the “Action Items” tab

E N D
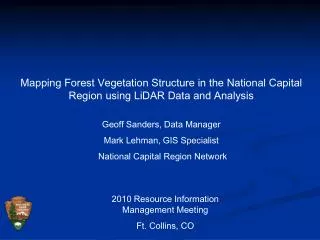
This presentation will probably involve audience discussion, which will create action items. Use PowerPoint to keep track of these action items during your presentation • In Slide Show, click on the right mouse button • Select “Meeting Minder” • Select the “Action Items” tab • Type in action items as they come up • Click OK to dismiss this box • This will automatically createan Action Item slide at the end of your presentation with your points entered. SRS - FIA Phase 3Measuring Vegetation Diversity and Structure in the Southern Region Sharon King Dept. of Forestry, Wildlife and Fisheries, University of TN in Cooperation with the USDA, Forest Service, Southern Research Station (Cooperative Agreement # SRS-02-CR-11330145-055)
Measuring Vegetation Diversity and Structure in the Southern Region This presentation was given at the 2002 State FIA Coordinators Meeting held in St. Augustine, FL October 9 and 10, 2002. This presentation is intended to introduce the State Coordinators to the P3 Vegetation Diversity and Structure indicator program. Results presented here are PRELIMINARY and only based on subsets of data gathered in the SC pilot study. For updated information, please contact Sharon King at 865-862-2044 or sharonking@fs.fed.us This work is funded by USFS Cooperative Agreement number SRS-02-CR-11330145-055.
What Is the P3 Vegetation Diversity and Structure Indicator? The measurement of species composition and vegetation structure of vascular plants on Phase 3 subplots Includes all trees, shrubs, herbs, grasses, ferns, and fern allies (horsetails and club mosses)
Objectives of the Program • To assess forest health in terms of structure, diversity, abundance and rates of change of vascular plant species • Particular interest in the following contexts: native vs. non-native species wildlife values wildland and prescribed fires
South Carolina P3 Vegetation Indicator Pilot Study • Objective: To evaluate the effort and costs associated with collecting all vegetation indicator variables on P3 plots for the state of SC • South Carolina had 32 P3 plots evaluated • Methods were those described in the March 2002 National Field Manual
Questions We Hoped to Answer From the SC Pilot Study • What kind of effort (botanist hours) is required to collect the data in the field using the outlined methods? • What is the best configuration for data sheets? • How much information is gained by each successive quadrat and subplot?
More Questions... • Are the variable measures sound and repeatable? • What kind of effort is required to document and identify unknown species? • What kind of effort is required to manage the data? • How does the Southern Region fit into the national program?
Pilot Study Timeline • April: Training in Macon, GA with Beth Schulz, National Indicator Advisor • May/June: Started the field season with 3 trips to SC; collected data from 4 plots • First plot done together • Other plots blind checked • June 18: Botanist started solo work with State P3 crew • September 17: Field work completed • October 1: Data turned into SC on 21 plots, 11 still being processed
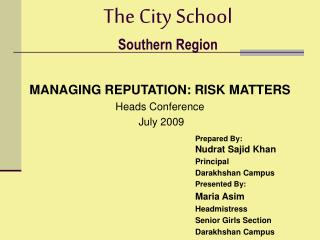
Vegetation Indicator Field Methods • Every plot contains four P3 subplots • Subplot = 24 ft radius circle • Every subplot contains three 1-m2 quadrats at 30o, 150o and 270o
Quadrat Measures (1m2 frame) 6 ft. • Cover of ground variables in quadrats to 1% • Cover of all species in, or overhanging quadrat (up to 6 ft) to 1%
Subplot Measures (24 ft. radius circle) • Identify all additional species on subplot and estimate cover to 1% Plot Center This subplot contained 33 additional species, 46 total
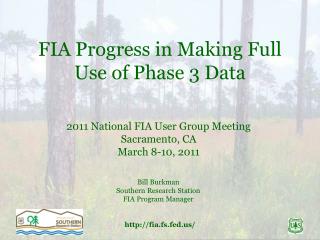
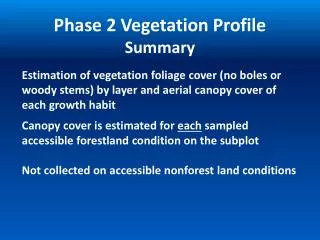
Example Vaccineum tenellum : Quadrat 3: 37% Subplot: 10% Layer: 1 (0-2 ft.) Total Cover (all spp.) in layer 1 (0-2 ft): 64% More Subplot Measures • For every species, layer of greatest foliage cover is recorded • For all four layer classes, total cover (of all species combined) is estimated to 1% Layer Classes 0-2 ft. 2-6 ft. 6-16 ft. 16+ ft.
16+ ft. 6-16 ft. 2-6 ft. 0-2 ft.
Dealing With Unknown Species • Species not known in the field are collected, tagged and bagged • All unknowns are assigned a number • Specimens are keyed, or logged and pressed • Protocol states that pressed unknowns are sent in to a herbarium for identification
Preliminary Study Results (Logistical) • Collected data on 32 Plots across state • Completed 72 out of 128 subplots (56%) • 115 hours spent on plot (Based on a subset of the data, does not include travel, locating plots, set-up, or any follow-up work off plot)
Preliminary Study Results (Biological)(From analysis of 10 plots, 26 subplots) • Total number of “species”: 353 • Ave. species per quadrat: 7 [3-15] • Ave. species per subplot: 38 [14-78] • Average unknowns/subplot: 9 [0-35] • Completed plots: 1 unknown/subplot • Estimate 75-130 unknowns for season once processed
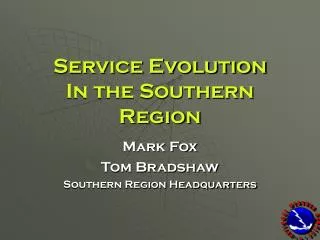
Time in the Field (per subplot) (From analysis of 9 plots, 21 subplots) • Quadrats: 24 min. • SP Search, T&B: 33 min. • Cover & Layer: 21 min. • Overall Layers: 4 min. • Miscellaneous: 14 min. Time to complete subplot ~ 1:36 ** Numbers do not reflect time to find or mark off plot Note: Analysis not complete!
Actual Time Spent on All Tasks(Projected from analysis of a subset of data) • Field time = 115 hrs • Plot set up = 32 hrs • Travel = 114 hrs • Specimens/data sheet clean-up = 115 hrs • Entry into NaTally = 22 hrs Time to complete pilot ~ 398 hours Note: Analysis not complete!
~ 398 hours to complete 56% of subplots in state Estimate ~ 616 hrs to complete all subplots (15.5 wks @ 40hrs/wk) Practically equal amounts of time needed for travel, data collection, and data management To implement region-wide we will need qualified botanists with specialized skills May need to be creative with funding and logistics on a state by state basis Summary
What’s Next From Here? • Compile complete data set from pilot and determine resource needs for region-wide implementation • Communicate with other regions to compare our experiences and share information • Evaluate goals, study methods, personnel and funding resources/needs to plan for implementation of the Vegetation Diversity and Structure Indicator program for all states in our region
Acknowledgements Byron Rominger Cindy Aulbach Beth Schulz SRS - FIA Univ. of TN, FWF