Download
1 / 8
80 likes | 346 Vues
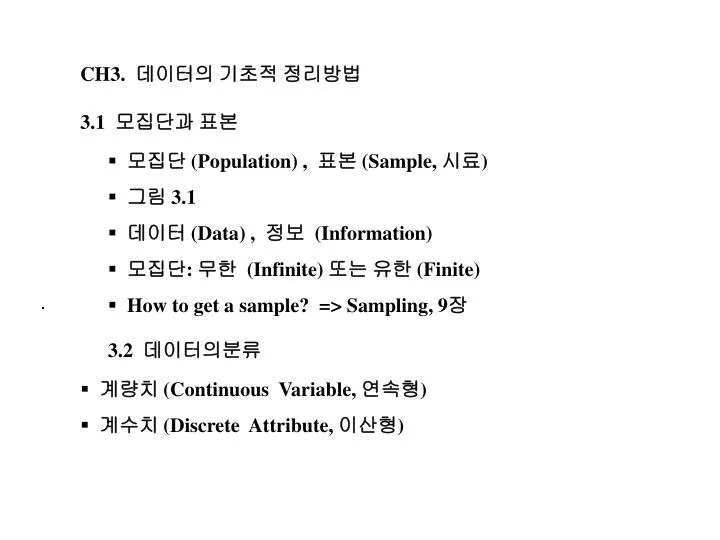
CH3. 데이터의 기초적 정리방법 3.1 모집단과 표본 모집단 (Population) , 표본 (Sample, 시료 ) 그림 3.1 데이터 (Data) , 정보 (Information) 모집단 : 무한 (Infinite) 또는 유한 (Finite) How to get a sample? => Sampling, 9 장 3.2 데이터의분류 계량치 (Continuous Variable, 연속형 )

E N D
CH3. 데이터의 기초적 정리방법 3.1 모집단과 표본 • 모집단 (Population) , 표본 (Sample, 시료) • 그림 3.1 • 데이터 (Data) , 정보 (Information) • 모집단: 무한 (Infinite) 또는 유한 (Finite) • How to get a sample? => Sampling, 9장 • 3.2 데이터의분류 • 계량치 (Continuous Variable, 연속형) • 계수치 (Discrete Attribute, 이산형)
3.3 모집단의 분포 (Distribution) • Why 모집단은 분포를 갖는가? • 우연원인(Chance cause): Statistically in control 상태로 유지 • 이상원인(Assignable cause) • 모집단을 정의하기 위해서 필요한 3가지 조건 • 모집단 분포의 형태, 모양: 4장, 연속확률분포, 이산확률분포 • 중심값 • 산포정도
3.3.2 중심값 • 모집단의 평균치: μ • 모르는 경우 샘플로 추정함 • 샘플 평균 (sample mean) • 기하평균 (geometric mean) • 중앙값 (median) • 범위의 중앙값 (mid-range) • 예제 3.1
모수(Population Parameter) 와 통계량 (Statistics) • 차이점은 모수는 모집단, 통계량은 샘플 • 모집단샘플 • 평균 • 분산 • 편차
3.3.3 산포도 • 모집단의 분산: σ2 • 모르는 경우 샘플로 추정 • 제곱합 (Sum of squares) • 불편분산 (Unbiased variance, Variance) = V • 표준편차 (Standard deviation) = s • 범위 (Range) = R • 변동계수 (Coefficient of variation) = Vc • 예제 3.2 • 3.3.4 수치변환 (Numerical Transformation) • 예제 3.3
불편추정량 (Unbiased Estimator) 정의 : • 모수 의 추정량 에 대해서가 성립할 때 • 를 모수 의 불편추정량 이라고 한다. • 기대값 (Expectation): (예) 주사위 던져서 나온값 • 은의 불편추정량이다. • 그러나 는 의 불편추정량이 아니다.
3.4 모집단 형태 • 3.4.1 도수분포표 (Frequency distribution table, Histogram) • 예제 - 품질특성치는 전구 수명 • 작성요령 • 보는 방법: 그림 3.3, 그림 3.4 • 누적도수 (Cumulative frequency) • 누적상대도수 (Relative cumulative frequency) • 3.4.5 줄기-잎 그림 (Stem and leaf display) • 그림 3.7
3.6 7가지 QC 기초수법 (1) 히스토그램 (Histogram) - 그림 3.8 (2) 특성요인도 (Cause and effect diagram) (3) 파레토그림 (Pareto diagram) (4) 체크시이트 (Check sheet) (5) 산점도 (Scatter diagram) (6) 층별 (Stratification) (7) 각종 그래프 (Graph)