Download
1 / 50
510 likes | 656 Vues
Demographic Transition Model. Population Changes. The total population of an area depends upon changes in the natural increase and migration. The natural increase (or decrease) is the difference between the birth rate and the death rate.

E N D
Population Changes • The total population of an area depends upon changes in the natural increase and migration. • The natural increase (or decrease) is the difference between the birth rate and the death rate. • The birth rate is the number of live births in a year for every 1000 people in the total population. • The death rate is the number of people in every 1000 who die in a year. • If the birth rate is higher then the total population will increase. If the death rate is higher then the total population will decrease.
Interactive • http://www.ngfl-cymru.org.uk/vtc/demographic_trans/eng/Introduction/Main1.htm part 1 • http://www.ngfl-cymru.org.uk/vtc/demographic_trans/eng/Introduction/Plenary.htm Part 2 • http://www.geographyalltheway.com/ib_geography/ib_population/ib_demographic_transition_model.htm GATW site
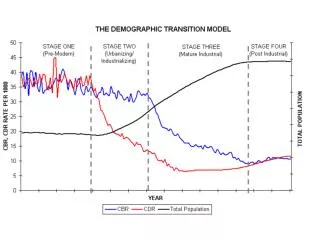
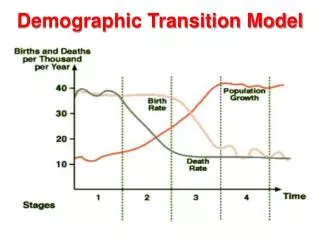
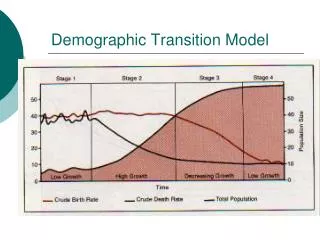
*The DTM describes a sequence of changes in the relationships between birth and death rates. • *The model was produced using changes in the natural increase in several countries in Western Europe and North America.
It suggests that the population growth rates for all countries can be divided into 4 stages.
Birth Rate - Very High • Death Rate - Very High • Natural Increase - Population Steady
Children needed for farming • They die at an early age due to illnesses • No family planning • And religious and social encouragement.
Disease • Famine • Poor medical knowledge and so many people die.
Stage 1 high stationary • little access to birth control • many children die in infancy (high infant mortality) so parents tend to have more children to compensate in the hopes that more will live • children are needed to work on the land to grow food for the family • children are regarded as a sign of virility in some cultures • religious beliefs (e.g. Roman Catholics and Hindus) encourage large families • high death rates, especially among children because of disease, famine, poor diet, poor hygiene, little medical science.
Birth Rate - Very High • Death Rate - Falling Rapidly • Natural Increase - Very Rapid Increase
Children needed for farming • They die at an early age due to illnesses • No family planning and religious and social encouragement. (same as stage 1)
Improvements in medical care • Water • Supply and sanitation • Fewer children die.
Stage 2 early expanding • improvements in medical care - hospitals, medicines, etc. • improvements in sanitation and water supply • quality and quantity of food produced rises • transport and communications improve the movements of food and medical supplies • decrease in infant mortality.
Birth Rate: Falling rapidly • Death Rate: Falling more slowly • Natural Increase: Rapid increase
Improved medical care and diet • Fewer children are needed
Improvements in medical care • Water • Supply and sanitation • Fewer children die
Stage 3 late expanding • increased access to contraception lower infant mortality rate means there is less need to have a bigger family • industrialisation and mechanisation means fewer labourers are required • the desire for material possessions takes over the desire for large families as wealth increases • equality for women means that they are able to follow a career path rather than feeling obligated to have a family
Birth Rate: Falling more slowly • Death rate: Slight fall • Natural Increase: Very slow increase
Family planning • Good health • Later marriages • Improving status of women
Good health care • Reliable food supply • People are living much longer
Stage 4 low stationary Both birth rates and death rates remain low, fluctuating with 'baby booms' and epidemics of illnesses and disease. This results in a steady population.
Birth Rate: Slight fall • Death Rate: Stable • Natural Increase: Gentle decrease
Family planning • Good health • Later marriages • Improving status of women
Good health care • Reliable food supply • People are living much longer
Stage 5??? declining A stage 5 was not originally thought of as part of the DTM, but some northern countries are now reaching the stage where total population is declining where birth rates have dropped below death rates. One such country is Germany, which has taken in foreign workers to fill jobs. The UK's population is expected to start declining by 2021.
Stage 1Ethiopia / BangladeshUK: pre-1780 Stage 2Sri Lanka / BrazilUK: 1780 - 1880 Stage 3Uruguay / ChinaUK: 1880 - 1940 Stage 4Canada / JapanUK: post-1940
Problems with the Demographic Transition Model • based on European experience, assumes all countries will progress to complete industrialization • many countries “stuck” in stage 2 or stage 3 • reflects logic of continuous growth, an impossibility • Does not take into account immigration
Interactive test • http://www.geographyalltheway.com/igcse_geography/population_settlement/population/popups/popup20.htm