Download
1 / 21
220 likes | 339 Vues
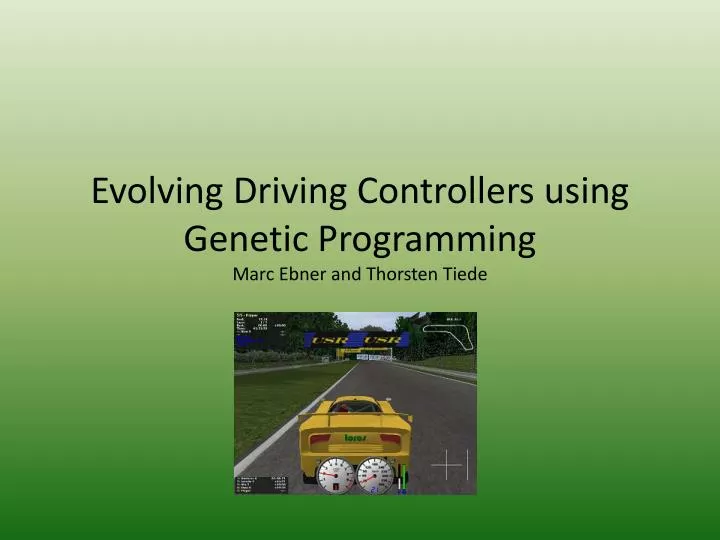
Evolving Driving Controllers using Genetic Programming Marc Ebner and Thorsten Tiede. The Torcs Simulator . 30 different tracks. 42 different cars. 50 optional opponents. 19 distance sensors . Can be steered using a joystick, an actual steering wheel , the mouse or the keyboard.

E N D
Evolving Driving Controllers using Genetic ProgrammingMarc Ebner and Thorsten Tiede
The Torcs Simulator • 30 different tracks. • 42 different cars. • 50 optional opponents. • 19 distance sensors . • Can be steered using a joystick, an actual steering wheel , the mouse or the keyboard. • Up to 4 different players can race against each other using a split screen mode.
Sensors Available From A Simulated Car Of The Racing Simulator
Evolution Of Virtual Race Car Drivers • Target - complete the race in the shortest amount of time. • The drivers are selected using the Darwinian principle “survival of the fittest”.
Implemantaion • tree-based Genetic Programming • Tree - Program. • external nodes - provide input to the program. • internal nodes – operations. • Each individual consists of two trees: • steering wheel - computes the steering direction. • gas/brake system - computes whether the car should accelerate or decelerate.
The Tracks - Each individual is evaluated for 1000 time steps on each track. - No other drivers are present on the track during evolution.
Fitness Function • F = Σfi / 5 ,i ∈ {1, 2, 3, 4, 5} • fi = dmax – d • d - the distance traveled along the track. • dmax = (maxTimeSteps/timeStepsPerSecond)*vmax • vmax- the maximum velocity of the car.
Selection • Elitism - The best 3 individuals are always copied into the next generation. • tournament selection • Tournament size = 7.
Crossover • selects two individuals and then exchanges two random subtrees between these two individuals.
Mutation • A randomly selected node is replaced by a newly generated subtree. • Each operator is applied with a probability of 50%. • Internal nodes are selected with a probability of 90% and external nodes are selected with a probability of 10%.
The Experiments • 4 experiments • Experiment 1: manually constructed individual inserted to the first generation. • Experiment 2: all individuals selected randomly. • Experiment 3: same as experiment 1 ,but with an extended function set. • Experiment 4: same as experiment 2 ,but with an extended function set. • Population size – 200 individuals in each experiment.
The Extended Function Set • The extended function set include 2 additionally functions • Sum : takes a single argument and sums up this argument over all time steps. • Last : returns the value which was computed during a previous evaluation of the node. • By adding these two elementary functions it is possible to evolve PID controllers in experiments 3 and 4.
PID controller • A PID controller calculates an "error" value as the difference between a measured process variable and a desired set point. • The PID controller calculation (algorithm) involves three separate parameters; the proportional, the integral and derivative values.
The Results • Experiments 1 and 3 created the best car drivers after 50 generations. • Starting from an entirely random population (as in Experiments 2 and 4) made the problem more difficult (statistically significant with a confidence of 94.7%). • There is no statistical significant difference between experiments 1 and 3 and also not between 2 and 4.
The Performance Of The Best Evolved Driver • The best car at generation 0 left the track when evaluated on tracks (c), (d), and (e). • At the first generation, the best individual is able to drive for a maximum distance of 498m (on track (b)). • At the end of evolution the best individual was able to cover a distance of 642m for this same track. • On track (e), the best controller from generation 0 actually left the track after only 66m. • after generation 50, it was able to drive for 624m on track (e) without leaving the track. • The best evolved controller uses only the current speed and the front facing sensor (S9)to control the acceleration of the car.