Download
1 / 140
1.4k likes | 1.4k Vues
Explore the divergent structure between online and offline media and the measurement structures. Learn about the performance metrics, marketing integration, and media reach levels in the past 10 years in Canada.

E N D
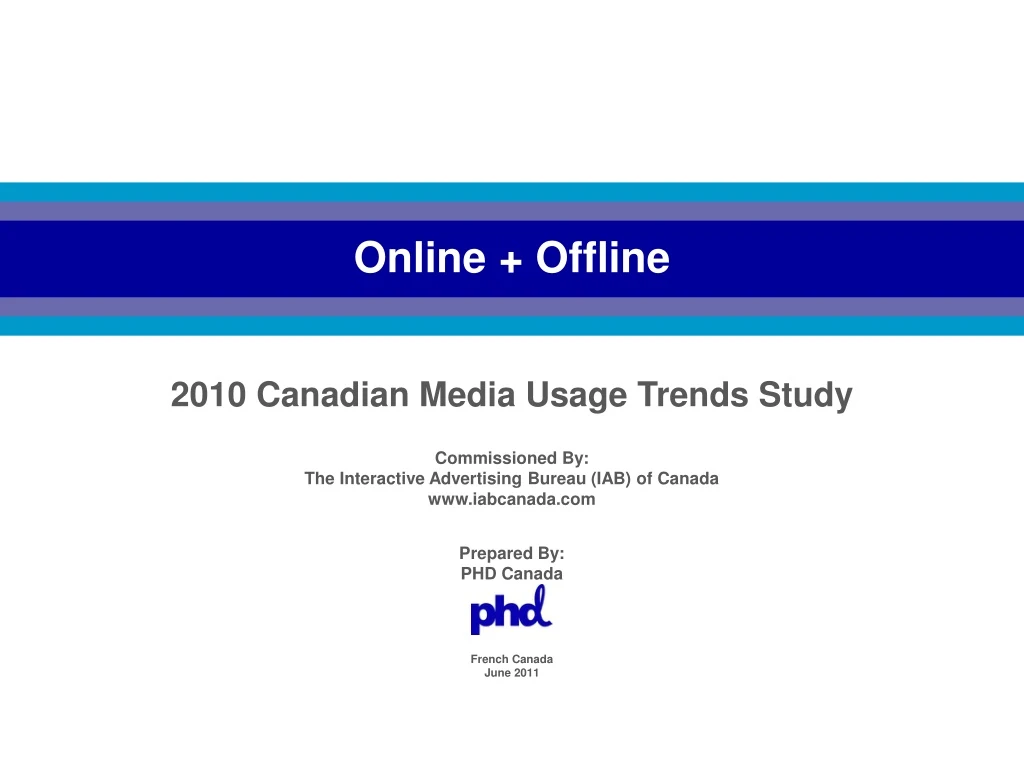
Online + Offline 2010 Canadian Media Usage Trends Study Commissioned By: The Interactive Advertising Bureau (IAB) of Canadawww.iabcanada.com Prepared By: PHD Canada French Canada June 2011
Online + Offline – Worlds Apart. On-Line Off-Line
Divergent Structure In The 2 Worlds. Online Offline Measurement structures Private Tripartite/Co-op Universe Digital Population Audience Time Units Daily Weekly Performance Metrics Click/Engage/Acquire Awareness Analytics Click/Engage/Acquire Exposure Opps Marketing Task Focus Result Brand Vehicle Cycles Fast Slow Turnaround Expectation Immediate Months out ∞ Fragmentation 10 Data Verification 3rd party 1st Party Expertise from Online Offline Expert in 10 4 Execution Border Borderless National Knowledge Border Borderless National/Regional
Must become a closer part of the “mix”. MARKETING INTEGRATION Online Offline
Common Ground For Comparison. Weekly Reach Weekly Time
CMUST Has Changed. From: Single (NADbank) source To: Buyer currency sources BBM (TV, Radio) PMB (Magazine) NADbank(Newspaper) Internet: No weekly data from comScore. NADbank for weekly Internet data. Use comScore in PMB fusion data base.
Six Buyer Currency Surveys Of Record. TELEVISION BBM PMT/Mark II Meter/PPM in Quebec Jan-Dec ‘02/Jan-Aug ’09 R A D I O BBM Diary Fall’00/Fall’09 INTERNET MOBILE Nielsen Mobile Media Measurement 2nd Quarter ’09/’10comScoreMobilens March ‘11 NADbank Telephone Readership study 2001/2009 NEWSPAPER NADbank Telephone Readership study 2001/2009 MAGAZINE PMB/comScore Fused Data Spring’10 PMB Recent Reading PMB’01/PMB Fall’10
How Have Media Reach Levels Changed Over Last 10 Years? REACH + TIME IMPERATIVES – 2D and 3D F U S I O N M O B I L E
Media Habits, On- + Offline, Over Last 10 Years. REACH + TIME IMPERATIVES – 2D and 3D F U S I O N M O B I L E
How Have Media Reach Levels Changed Over Last 10 Years? Adults 18+ Weekly Reach 100% 80% 60% 40% 20% 0% ‘00 ‘09 Source: French Canada, see Data Source slide
Internet Reach Has Increased By 51%. TELEVISION R A D I O NEWSPAPER MAGAZINE INTERNET Adults 18+ Weekly Reach 99% 97% 100% 93% 92% 78% 151 80% 73% 77% 68% 102 57% 60% 2000 =100 index 99 45% 94 40% 74 20% 0% ‘00 ‘09 Source: French Canada, see Data Source slide
Examine Weekly Reach By Demographic Group. 2009 Weekly Reach % TELEVISION R A D I O NEWSPAPER MAGAZINE INTERNET TELEVISION R A D I O MAGAZINE NEWSPAPER INTERNET Adults 18+ Weekly Reach 18+ 99% 100% 92% 80% 73% 68% 57% 60% 40% 20% 0% ‘09 Source: French Canada, see Data Source slide
2009 Weekly Reach % TELEVISION R A D I O MAGAZINE NEWSPAPER INTERNET 18+ 18-24 25-34 35-54 55+ 99% 99% 99% 99% 99% 100% 96% 93% 92% 89% 84% 81% 80% 75% 80% 74% 74% 73% 73% 68% 68% 64% 61% 57% 57% 60% 51% 49% 40% 20% 0% Source: French Canada, see Data Source slide
Internet Is Most Under-55 Skewed Medium. 2009 Weekly Reach % INTERNET TELEVISION R A D I O MAGAZINE NEWSPAPER INTERNET 18+ 18-24 25-34 35-54 55+ 99% 99% 99% 99% 99% 100% 96% 93% 92% 89% 84% 81% 80% 75% 80% 74% 74% 73% 73% 68% 68% 64% 61% 57% 57% 60% 51% 49% 40% 20% 0% Source: French Canada, see Data Source slide
2009 Weekly Reach % TELEVISION R A D I O MAGAZINE NEWSPAPER INTERNET 18+ 18-24 25-34 35-54 55+ M W 99% 99% 99% 99% 99% 99% 99% 100% 96% 93% 92% 91% 92% 89% 84% 81% 80% 77% 75% 80% 74% 74% 73% 73% 69% 69% 68% 68% 67% 64% 61% 61% 57% 57% 60% 53% 51% 49% 40% 20% 0% Source: French Canada, see Data Source slide
Internet Is Slightly Male Skewed. 2009 Weekly Reach % INTERNET TELEVISION R A D I O MAGAZINE NEWSPAPER INTERNET 18+ 18-24 25-34 35-54 55+ M W 99% 99% 99% 99% 99% 99% 99% 100% 96% 93% 92% 91% 92% 89% 84% 81% 80% 77% 75% 80% 74% 74% 73% 73% 69% 69% 68% 68% 67% 64% 61% 61% 57% 57% 60% 53% 51% 49% 40% 20% 0% Source: French Canada, see Data Source slide
2009 Weekly Reach % TELEVISION R A D I O MAGAZINE NEWSPAPER INTERNET $75 m+ 18+ 18-24 25-34 35-54 55+ M W 99% 99% 99% 99% 99% 99% 99% 99% 100% 96% 93% 92% 91% 91% 92% 89% 84% 81% 80% 80% 77% 77% 75% 80% 74% 74% 73% 73% 69% 69% 68% 68% 67% 64% 64% 61% 61% 57% 57% 60% 53% 51% 49% 40% 20% 0% Source: French Canada, see Data Source slide
Internet Has Upper Income Skew. 2009 Weekly Reach % INTERNET TELEVISION R A D I O MAGAZINE NEWSPAPER INTERNET $75 m+ 18+ 18-24 25-34 35-54 55+ M W 99% 99% 99% 99% 99% 99% 99% 99% 100% 96% 93% 92% 91% 91% 92% 89% 84% 81% 80% 80% 77% 77% 75% 80% 74% 74% 73% 73% 69% 69% 68% 68% 67% 64% 64% 61% 61% 57% 57% 60% 53% 51% 49% 40% 20% 0% Source: French Canada, see Data Source slide
2009 Weekly Reach % TELEVISION R A D I O MAGAZINE NEWSPAPER INTERNET $75 m+ Univ+ 18+ 18-24 25-34 35-54 55+ M W 99% 99% 99% 99% 99% 99% 99% 99% 99% 100% 96% 93% 92% 91% 93% 91% 92% 89% 84% 81% 80% 80% 77% 79% 77% 79% 75% 80% 74% 74% 73% 73% 69% 69% 68% 68% 67% 64% 64% 61% 61% 58% 57% 57% 60% 53% 51% 49% 40% 20% 0% Source: French Canada, see Data Source slide
Internet Has University+ Skew. 2009 Weekly Reach % INTERNET TELEVISION R A D I O MAGAZINE NEWSPAPER INTERNET $75 m+ Univ+ 18+ 18-24 25-34 35-54 55+ M W 99% 99% 99% 99% 99% 99% 99% 99% 99% 100% 96% 93% 92% 91% 93% 91% 92% 89% 84% 81% 80% 80% 77% 79% 77% 79% 75% 80% 74% 74% 73% 73% 69% 69% 68% 68% 67% 64% 64% 61% 61% 58% 57% 57% 60% 53% 51% 49% 40% 20% 0% Source: French Canada, see Data Source slide
2009 Weekly Reach % TELEVISION R A D I O MAGAZINE NEWSPAPER INTERNET Total Canada $75 m+ Univ+ 18+ 18-24 25-34 35-54 55+ M W 99% 99% 99% 99% 99% 99% 99% 99% 99% 99% 100% 96% 93% 92% 91% 93% 92% 91% 92% 89% 84% 81% 80% 80% 77% 79% 77% 79% 75% 80% 74% 73% 74% 73% 73% 71% 69% 69% 68% 68% 67% 64% 64% 61% 60% 61% 58% 57% 57% 60% 53% 51% 49% 40% 20% 0% Source: French Canada, see Data Source slide
Internet Has Slightly Deeper Reach Outside French Canada. 2009 Weekly Reach % INTERNET TELEVISION R A D I O MAGAZINE NEWSPAPER INTERNET Total Canada Univ+ $75 m+ 18+ 18-24 25-34 35-54 55+ M W 99% 99% 99% 99% 99% 99% 99% 99% 99% 99% 100% 96% 93% 92% 91% 92% 93% 91% 92% 89% 84% 81% 80% 80% 77% 79% 77% 79% 75% 80% 74% 73% 74% 73% 73% 71% 69% 69% 68% 68% 67% 64% 64% 61% 60% 61% 58% 57% 57% 60% 53% 51% 49% 40% 20% 0% Source: French Canada, see Data Source slide
Internet Reach… 10 YEAR GROWTH Most rapid... +51% AGE Most under-55 skewed. SEX Slight male skew. INCOME Upper income skew. EDUCATION University+ skew. LANGUAGE Slight French underdevelopment.
Weekly Time Spent Is A Surrogate For Ad Exposure. REACH + TIME IMPERATIVES – 2D and 3D F U S I O N M O B I L E
Weekly Time Spent Per Capita Allows For Media Comparison. Adults 18+ Weekly Time (minutes) 2,000 1,500 1,000 500 ‘00 ‘09 Source: French Canada, see Data Source slide
Time Spent With Internet Has More Than Doubled Since 2001. TELEVISION R A D I O NEWSPAPER MAGAZINE INTERNET Adults 18+ Weekly Time (minutes) 2,000 210 1,935 1,659 1,500 1,308 117 1,169 2000 =100 index 1,000 89 81 51 519 500 245 167 135 105 55 ‘00 ‘09 Source: French Canada, see Data Source slide
Share Is A Helpful Way To Look At “Time”. TELEVISION R A D I O NEWSPAPER MAGAZINE INTERNET Adults 18+ Weekly Time (minutes) 2,000 1,935 2000 2009 minutes share minutes share 1,659 1,659 1,308 245 167 105 1,935 1,169 519 135 55 TELEVISION R A D I O INTERNET NEWSPAPER MAGAZINE 48% 38% 7% 5% 3% 100% 51% 31% 14% 4% 1% 100% 1,500 1,308 1,169 TOTAL 3,484 3,813 1,000 519 500 245 167 135 105 55 ‘00 ‘09 Source: French Canada, see Data Source slide
Total Time Spent With Media Grew By 9% Adults 18+ Weekly Time (minutes) 2,000 2000 2009 minutes share minutes share 1,659 1,308 245 167 105 1,935 1,169 519 135 55 TELEVISION R A D I O INTERNET NEWSPAPER MAGAZINE 48% 38% 7% 5% 3% 100% 51% 31% 14% 4% 1% 100% 1,500 TOTAL 3,484 3,813 1,000 500 ‘00 ‘09 Source: French Canada, see Data Source slide
Internet Doubled Its Share Of Media Time Since 2001. Adults 18+ Weekly Time (minutes) 2,000 2000 2009 +3 points minutes share minutes share 1,659 1,308 245 167 105 1,935 1,169 519 135 55 TELEVISION R A D I O INTERNET NEWSPAPER MAGAZINE 48% 38% 7% 5% 3% 100% 51% 31% 14% 4% 1% 100% - 7 points 1,500 +7 points - 1 points - 2 point TOTAL 3,484 3,813 1,000 500 ‘00 ‘09 Source: French Canada, see Data Source slide
2009 Share % of Weekly Minutes Per Capita TELEVISION R A D I O MAGAZINE NEWSPAPER INTERNET 18+ 50% 51% 2000 2009 +3 points minutes share minutes share 40% 1,659 1,308 245 167 105 3,484 1,935 1,169 519 135 55 3,813 TELEVISION R A D I O INTERNET NEWSPAPER MAGAZINE 48% 38% 7% 5% 3% 100% 51% 31% 14% 4% 1% 100% - 7 points +7 points - 1 points 31% 30% - 2 point TOTAL 20% 14% 10% 4% 1% 0% Source: French Canada, see Data Source slide
2009 Share % of Weekly Minutes Per Capita TELEVISION R A D I O MAGAZINE NEWSPAPER INTERNET 59% 18+ 18-24 25-34 35-54 55+ 50% 51% 47% 46% 40% 40% 35% 34% 31% 30% 30% 28% 22% 20% 20% 14% 14% 10% 6% 5% 4% 3% 2% 2% 2% 2% 2% 1% 1% 0% Source: French Canada, see Data Source slide
The Internet Has A Uniquely Strong Under-55 Skew. 2009 Share % of Weekly Minutes Per Capita TELEVISION R A D I O MAGAZINE NEWSPAPER INTERNET INTERNET 59% 18+ 18-24 25-34 35-54 55+ 50% 51% 47% 46% 40% 40% 35% 34% 31% 30% 30% 28% 22% 20% 20% 14% 14% 10% 6% 5% 4% 3% 2% 2% 2% 2% 2% 1% 1% 0% Source: French Canada, see Data Source slide
Internet And TV… Mirror Image Age Profiles. 2009 Share % of Weekly Minutes Per Capita TELEVISION INTERNET 59% 18+ 18-24 25-34 35-54 55+ 50% 51% 47% 46% 40% 40% 30% 30% 22% 20% 14% 14% 10% 6% 0% Source: French Canada, see Data Source slide
2009 Share % of Weekly Minutes Per Capita TELEVISION R A D I O MAGAZINE NEWSPAPER INTERNET 59% 53% 18+ 18-24 25-34 35-54 55+ M W 50% 51% 48% 47% 46% 40% 40% 35% 34% 31% 31% 30% 30% 30% 28% 22% 20% 20% 16% 14% 14% 11% 10% 6% 4% 5% 4% 3% 3% 2% 2% 2% 2% 2% 2% 1% 1% 1% 0% Source: French Canada, see Data Source slide
Internet Has A Moderate Male Skew. 2009 Share % of Weekly Minutes Per Capita TELEVISION R A D I O MAGAZINE NEWSPAPER INTERNET INTERNET 59% 53% 18+ 18-24 25-34 35-54 55+ M W 50% 51% 48% 47% 46% 40% 40% 35% 34% 31% 31% 30% 30% 30% 28% 22% 20% 20% 16% 14% 14% 11% 10% 6% 4% 5% 4% 3% 3% 2% 2% 2% 2% 2% 2% 1% 1% 1% 0% Source: French Canada, see Data Source slide
2009 Share % of Weekly Minutes Per Capita TELEVISION R A D I O MAGAZINE NEWSPAPER INTERNET 59% 53% $75 m+ 18+ 18-24 25-34 35-54 55+ M W 50% 51% 48% 47% 46% 43% 40% 40% 35% 34% 33% 31% 31% 30% 30% 30% 28% 22% 20% 20% 18% 16% 14% 14% 11% 10% 6% 4% 4% 5% 4% 3% 3% 2% 2% 2% 2% 2% 2% 2% 1% 1% 1% 0% Source: French Canada, see Data Source slide
Internet Has A Strong High Income Skew. 2009 Share % of Weekly Minutes Per Capita TELEVISION R A D I O MAGAZINE NEWSPAPER INTERNET INTERNET 59% 53% $75 m+ 18+ 18-24 25-34 35-54 55+ M W 50% 51% 48% 47% 46% 43% 40% 40% 35% 34% 33% 31% 31% 30% 30% 30% 28% 22% 20% 20% 18% 16% 14% 14% 11% 10% 6% 4% 4% 5% 4% 3% 3% 2% 2% 2% 2% 2% 2% 2% 1% 1% 1% 0% Source: French Canada, see Data Source slide
Internet And TV… Mirror Image Income Profiles. 2009 Share % of Weekly Minutes Per Capita TELEVISION INTERNET $75 m+ 18+ 50% 51% 43% 40% 30% 20% 18% 14% 10% 0% Source: French Canada, see Data Source slide
2009 Share % of Weekly Minutes Per Capita TELEVISION R A D I O MAGAZINE NEWSPAPER INTERNET 59% 53% $75 m+ Univ+ 18+ 18-24 25-34 35-54 55+ M W 50% 51% 48% 47% 46% 43% 43% 40% 40% 35% 34% 33% 31% 31% 31% 30% 30% 30% 28% 22% 21% 20% 20% 18% 16% 14% 14% 11% 10% 6% 4% 4% 5% 4% 4% 3% 3% 2% 2% 2% 2% 2% 2% 2% 2% 1% 1% 1% 0% Source: French Canada, see Data Source slide
Internet Has A Strong University+ Skew. 2009 Share % of Weekly Minutes Per Capita TELEVISION R A D I O MAGAZINE NEWSPAPER INTERNET INTERNET 59% 53% $75 m+ Univ+ 18+ 18-24 25-34 35-54 55+ M W 50% 51% 48% 47% 46% 43% 43% 40% 40% 35% 34% 33% 31% 31% 31% 30% 30% 30% 28% 22% 21% 20% 20% 18% 16% 14% 14% 11% 10% 6% 4% 4% 5% 4% 4% 3% 3% 2% 2% 2% 2% 2% 2% 2% 2% 1% 1% 1% 0% Source: French Canada, see Data Source slide
Internet And TV… Mirror Image Education Profiles. 2009 Share % of Weekly Minutes Per Capita TELEVISION INTERNET Univ+ 18+ 50% 51% 43% 40% 30% 21% 20% 14% 10% 0% Source: French Canada, see Data Source slide
2009 Share % of Weekly Minutes Per Capita TELEVISION R A D I O MAGAZINE NEWSPAPER INTERNET 59% Total Canada 53% $75 m+ Univ+ 18+ 18-24 25-34 35-54 55+ M W 50% 51% 48% 47% 47% 46% 43% 43% 40% 40% 35% 34% 33% 31% 31% 31% 31% 30% 30% 30% 28% 22% 21% 20% 20% 18% 18% 16% 14% 14% 11% 10% 6% 4% 4% 5% 4% 4% 3% 3% 3% 2% 2% 2% 2% 2% 2% 2% 2% 1% 1% 1% 1% 0% Source: French Canada, see Data Source slide
Internet’s Share Is Higher In Total Canada. 2009 Share % of Weekly Minutes Per Capita TELEVISION R A D I O MAGAZINE NEWSPAPER INTERNET INTERNET 59% Total Canada 53% $75 m+ Univ+ 18+ 18-24 25-34 35-54 55+ M W 50% 51% 48% 47% 47% 46% 43% 43% 40% 40% 35% 34% 33% 31% 31% 31% 31% 30% 30% 30% 28% 22% 21% 20% 20% 18% 18% 16% 14% 14% 11% 10% 6% 4% 4% 5% 4% 4% 3% 3% 3% 2% 2% 2% 2% 2% 2% 2% 2% 1% 1% 1% 1% 0% Source: French Canada, see Data Source slide
Internet Time Spent… 10 YEAR GROWTH Most rapid… doubled +. AGE Uniquely under 55. SEX Moderate male skew. INCOME Strong high income skew. EDUCATION Strong university+ skew. LANGUAGE Slightly higher in Total Canada.
REACH + TIME IMPERATIVES – 2D and 3D F U S I O N M O B I L E
IMPERATIVES Product users gravitate towards different media.
Internet Imperative coding available in PMB ‘10. IAB-commisioned custom coding available. Internet/TV Internet/Magazine Internet/Newspaper Internet/Radio
Imperatives created through media usage segmentation. LIGHTER TV HEAVIER TV HEAVIER INTERNET LIGHTER INTERNET PMB Fall ‘10
4 Imperative segments of roughly equal size. LIGHTER TV HEAVIER TV HEAVIER INTERNET INTERNET IMPERATIVE TV IMPERATIVE DUAL LIGHT LIGHTER INTERNET PMB Fall ‘10
A radar chart helps to explain “propensity” indices. Internet Imperative Light Dual TV Imperative