Download
1 / 17
180 likes | 286 Vues
Development Indicators. Nilometer. Situation to be verified. Determine the optimal tax level. Criteria. Water level of Nile. The level of water of the Nile determines the yield of crops. The tax level depends largely on the yields. Causality (Hypothesis). Indicator.

E N D
Nilometer Situation to be verified Determine the optimal tax level Criteria Water level of Nile The level of water of the Nile determines the yield of crops. The tax level depends largely on the yields Causality (Hypothesis) Indicator Cubits (measure of length, 45.75 cm; Elle) on the Nilometer indicating the water level Target Between 13 and 16 12 hunger 13 enough; 14 joy; 15 security; 16 abundance 17 floods, disaster Comparison Average measures over years (benchmarks) Observation on Nilometer by qayas (officials) Method Responsability Ruler (Pharao, Wesir) Use for steering (decision-making) To determine the tax level according to crop yield
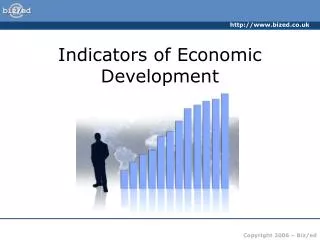
Introduction to Indicators • Indicators should provide - key information to guide implementation - Signals of change that show the extent of progress • An indicator is a variable that allows the verification of changes in the development intervention or shows results relative to what was planned (DAC/OECD)
Why are indicators important? • To enhance external accountability • indicators should provide the basis for transparent communication with external stakeholders – to whom the development intervention is more or less accountable • To improve wider learning • with managed exchange within and between organisations reduce costs and increase effectiveness of development actions • To improve performance • feedback mechanism with indicators allows to make appropriate management decisions to improve performance
How to measure development? • Initially, the level of “development” of one country was measured through its average income, so called “gross domestic product” (GDP). • Financial means alone cannot cover all aspects of “development” • Around 1990, a new index was created
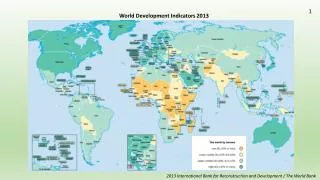
5 groups Countries* with Very high level of development High level of development Medium level of development Low level of development Countries not included, due to lack of data
What does the HDI tell us? The HDI was created to emphasize that people and their capabilities should be the ultimate criteria for assessing the development of a country, not economic growth alone. The HDI can also be used to question national policy choices, asking how two countries with the same level of income per capita can end up with such different human development outcomes. An example The Bahamas and New Zealand have similar levels of income per person, but life expectancy and expected years of schooling differ greatly between the two countries, resulting in New Zealand having a much higher HDI value than the Bahamas. • These differences can start debate about government policy priorities.
The HDI should allow a measurement of the level of development, which is closer to people's needs and takes into account many aspects of development. Development should increase the possibilities of people. Development objectives should include values such as (for example) • better nutrition • health, education • recreation • opportunities for participation of the people
All data are included in the yearly publication of the Human Development Report
7 Cumulative Impacts of Poverty Inability to afford adequate housing Lack of collateral collateral/access to credits for business or housing Sense of insecurity, isolation, and disempowerment Tenure insecurity, evictions, loss of small savings invested in housing Limited or no safety (social, economic) net Lack of legal protection/rule of law and citizen rights Inability to have a regular job, lack of regular income and social security Lack of infrastructure; un-hygienic living conditions, low quality public services Poor health, poor education* (based on IIED, WB)
8 Core Dimensions of Poverty and Wellbeing • Protective • Capabilities enabling people to withstand: • economic shocks • natural disasters • conflicts • Political • Capabilities including: • human rights • voice • political freedom • participation • Economic • Capabilities to: • earn income • consume • have assets • Human • Capabilities, based on: • health • education • membership • shelter • Socio-cultural • Capabilities concerning: • dignity • valued membership of society • social status (based on OECD 2001)
Another culture – another procedureBhutan Gross national happiness an attempt to define an indicator that measures quality of life or social progress in more holistic and psychological terms than only the economic indicator of gross domestic product (GDP).
Assessment of socioeconomic development by tracking seven development areas (1) Economic Wellness:Indicated via direct survey and statistical measurement of economic metrics such as consumer debt, average income to consumer price index ratio and income distribution (2) Environmental Wellness: Indicated via direct survey and statistical measurement of environmental metrics such as pollution, noise and traffic (3) Physical Wellness: Indicated via statistical measurement of physical health metrics such as severe illnesses (4) Mental Wellness: Indicated via direct survey and statistical measurement of mental health metrics such as usage of antidepressants and rise or decline of psychotherapy patients (5) Workplace Wellness: Indicated via direct survey and statistical measurement of labor metrics such as jobless claims, job change, workplace complaints and lawsuits (6) Social Wellness: Indicated via direct survey and statistical measurement of social metrics such as discrimination, safety, divorce rates, complaints of domestic conflicts and family lawsuits, public lawsuits, crime rates (7) Political Wellness: Indicated via direct survey and statistical measurement of political metrics such as the quality of local democracy, individual freedom, and foreign conflicts.
Multidimensional Poverty Index (MPI)database: household surveys in 104 countries deprived if: • no household member has completed five year of schooling • any school-aged child is not attending school in years 1 to 8 • any adult or child for whom there is nutritional information is malnourished • sanitation facility not improved or improved but shared • ……