Download

1 / 11
110 likes | 113 Vues
This study aims to predict runoff from unpaved roads in Culebra, PR and determine which road segments produce the most runoff. The data will be analyzed to calculate total runoff and map the information in an informative way.

E N D
Quantifying Runoff Rates for Road Segments in Culebra, PR By: Preston McLaughlin 11/13/2018
Introduction and Background • Terrigenous sediment from development is a key stressor influencing the global decline of coral reef ecosystems. • Higher turbidity = smothering, bleaching, reduced photosynthetic activity, and increased risk of disease • Corals act as nurseries for almost 1/3 of all marine fish species. • Up to 60% of all global coral is estimated to be lost by the year 2030. Banderote Reef, at Tamarindo Bay, Culebra Alfredo Montanez, 2012
For small Caribbean watersheds, unpaved roads have been shown to be the main contributor of sediment that reaches the coast. • Erosion rates from unpaved roads can be orders of magnitude greater than that of the surrounding undisturbed environments
Project Objectives • 1. Predict how much runoff is being produced from unpaved roads at one of our study sites • 2. Create stream segments for my study area with available LiDAR DEM data • 3. Determine which segments of road are producing the most runoff • 4. Calculate total runoff being deposited into nearby streams from road • 5. Map this information in a clear and informative way
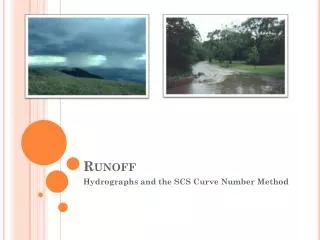
Ungraded Road Graded Road Soil Field Data Collection 0 -10% 11 -20% >20% 0 -10% 0 -10% 11 -20% 11 -20% >20% >20% • 45 Rainfall Simulations at the plot scale for roads and undisturbed hillslope surfaces • Data collection for naturally occurring rainfall events over a 2 year period using tipping bucket rain gauges • Surveying and sketch mapping of road segment dimensions and drainage points
Study Area • Located 28 km (17 mi.) east of mainland Puerto Rico • Sub-Tropical Arid climate with annual rainfall of around 70 cm per year • Very hilly with a maximum elevation of 194 m • 1 of 4 priority coral reef management sites in Puerto Rico • Sparsely populated (1,800 residents) • Significant increase in development since 1990s
GIS Data Sources Collected • LiDAR DEM raster with 1 meter resolution (NOAA Digital Coast Online Database) • Satellite imagery with 10 meter resolution • Unpaved road and watershed polyline shapefiles from the non-profit organization “Protectores de Cuencas”
Statistical Analysis • Infiltration capacity curve values for graded and ungraded road rainfall simulations will be taken and compared with one another using a t-test • Horton’s equation will be used to calculate infiltration capacity • A hyetograph representing all recorded rainfall events over a 2 year period • Rainfall intensity compared with an averaged infiltration capacity Figure 7. Measured monthly rainfall from August-2017 through February-2018 for three locations in Culebra NSE 0.72
GIS Analysis So Far… • Upload and properly project all raster, vector and GPS point data • Cleanup catchment and road shapefiles (snap vertices, delete old roads, etc.) • Modify DEM, fill, run flow direction, run flow accumulation, delineate stream length, and convert stream raster to vector
Remaining Work • Complete remaining infiltration capacity curves for rainfall simulation data • Collect and analyze rainfall data • Produce a model that predicts runoff rates for different rainfall intensities • Break road shapefile into segments, and assign individual drainage points for each segment • Use road segment area and predicted runoff depth to calculate volume of runoff • Calculate runoff rates for entire road • Potentially use “Trace Downstream” tool to find flow direction of drainage points • Generate maps that represent this information
![[09999684955] mira road property rates***affinityconsultant.](https://cdn0.slideserve.com/126864/slide1-dt.jpg)