Download
1 / 8
90 likes | 257 Vues
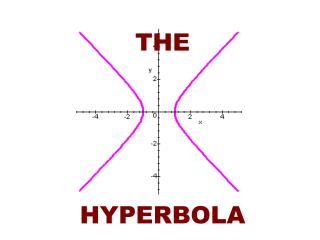
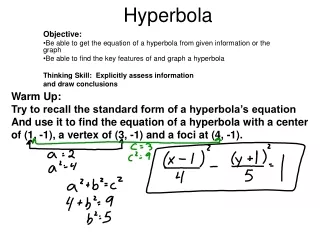
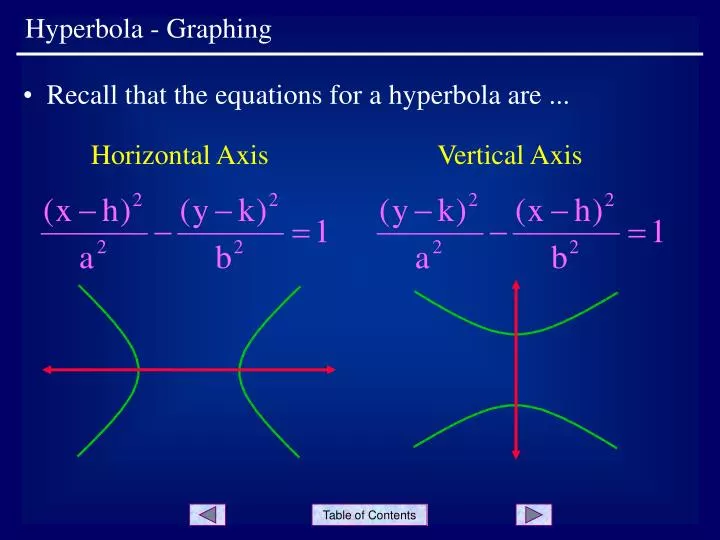
Hyperbola - Graphing. Recall that the equations for a hyperbola are . Horizontal Axis. Vertical Axis. Hyperbola - Graphing. The center of the hyperbola is located at the point (h, k) . Example 1: Determine the center of the hyperbola given by .

E N D
Hyperbola - Graphing • Recall that the equations for a hyperbola are ... Horizontal Axis Vertical Axis
Hyperbola - Graphing • The center of the hyperbola is located at the • point (h, k) ... • Example 1: • Determine the center of • the hyperbola given by ... • The center is at C(7, -3). Slide 2
Horizontal Axis Vertical Axis Hyperbola - Graphing • Note how the position of the a is always with the positive term, and the b is always with the negative term. • Also, when the positive term includes x, the axis is horizontal. When the positive term includes y, the axis is vertical. Slide 3
a a Hyperbola - Graphing • The vertices of the hyperbola are located on the axis ... and are a units from the center. Horizontal Axis Vertical Axis Slide 4
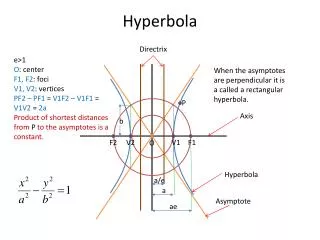
Hyperbola - Graphing • The foci lie on the axis and are c units from the center where ... • Summary: The center is at C(h, k). The vertices are a units from the center on the axis. The foci are c units from the center on the axis. • The remaining techniques for graphing a hyperbola will be shown in the next example. Slide 4
Hyperbola - Graphing • Example 2: • Sketch the graph of the • hyperbola given by ... • The center is at C(-4, 1). • Since the positive term includes the y, the axis is vertical. • The value of c is given by ... Table of Contents Slide 4 © 2000 Alan J. Dinwiddie, Jerry C. Neve
F (- 4 , 1 + 34 ) F (- 4 , 1 – 34 ) 12 8 4 - 8 - 4 4 - 4 - 8 Hyperbola - Graphing • Draw diagonals through the corners of the box. These lines form asymptotes for the hyperbola ... • As a last step, the foci can be plotted ... • Sketch the center at C(-4, 1) ... • Now plot the vertices a = 5 units above and below the center ... • Plot two more points b = 3 units to the left and right of the center ... • Use the four points to draw a rectangle ... • Use the vertices and the asymptotes to sketch the hyperbola ... V (- 4 , 6) C (- 4, 1) V (- 4 , - 4) Slide 4
Hyperbola - Graphing END OF PRESENTATION Click to rerun the slideshow.